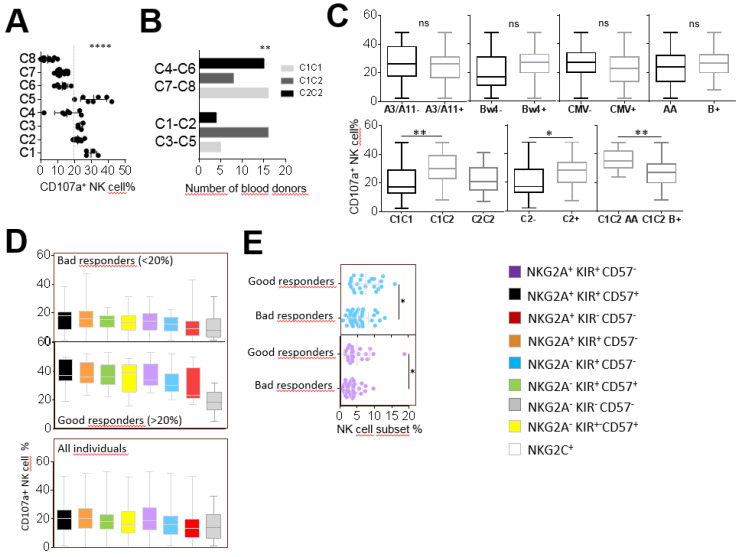
Figure 4.
CD57+ NK cell subsets are the most efficient against the KG1 AML cell line. (A) Dot plots illustrating the whole NK cell degranulation of eight clusters of individuals. (B) Histograms indicating the number of individuals according to HLA-C environment (C1C1, C1C2 and C2C2) for good (C1, C2, C3 and C5) and bad (C4, C6, C7 and C8) responders. (C) Whisker graphs representing whole NK cell degranulation according to A3/A11, Bw4, C1, C2 environments, KIR genotype (AA or B+) and CMV status investigated in 68 individuals. (D) Whisker graphs illustrating the degranulation frequency of eight NK cell subsets against the KG1 AML cell line from bad and good responders and from all individuals (n = 68). NK cell subsets are classified from the highest to the lowest efficiency. (E) Dot plots illustrating the NK cell frequency of NKG2A+ KIR− CD57− (blue) and NKG2A+ KIR+ CD57− (purple) NK cell subsets for bad and good responders. p-values are indicated only where a significant p-value was obtained (p < 0.05). * Indicates p < 0.05, ** indicates p < 0.01, **** indicates p < 0.0001.

