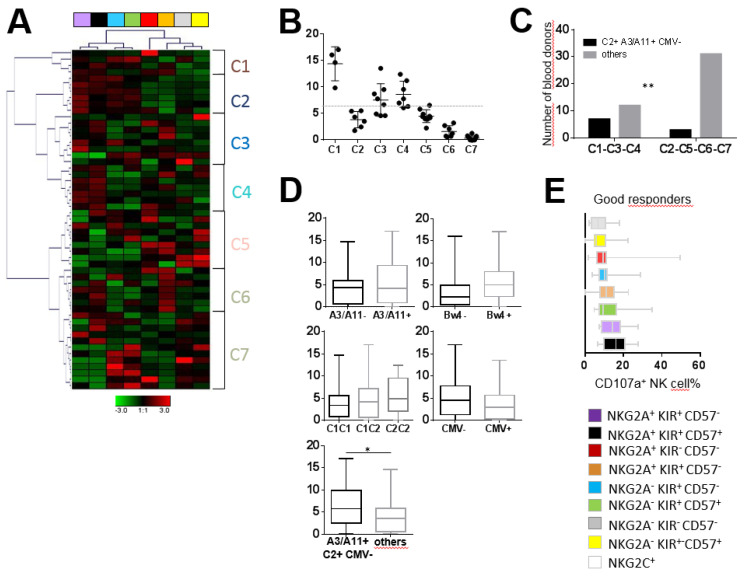
Figure 5.
KIR+ NK cell subsets are the most efficient against primary AML blasts. (A) Heatmap (Genesis®) clustering of healthy blood donors (n = 51) from the degranulation of eight targeted NK cell subsets. NK cell subset degranulation was assessed after 5 h incubation in the presence of primary AML target cells at an effector/target ratio of 1:1. Each column is dedicated to a defined NK cell subset. Red and green indicate high frequency and low frequency of NK cell degranulation, respectively. C1–C7 indicate the seven clusters of individuals. (B) Dot plots illustrating whole NK cell degranulation of blood donors clustered from C1 to C7. (C) Histograms illustrating the number of individuals according to A3/A11, C2 environment and CMV for bad (C2, C5, C6 and C7) and good (C1, C3 and C4) responders. (D) Whisker graphs of whole NK cell degranulation according to HLA-Bw4, A3/A11, C1 and C2 environments and CMV status in 51 individuals. (E) Whisker graphs of the degranulation frequency of the eight investigated NK cell subsets against primary AML target cells for the good (C1, C3 and C4) responders. NK cell subsets are classified from the highest to the lowest efficiency. p-values are indicated only where a significant p-value was obtained (p < 0.05). * Indicates p < 0.05, ** indicates p < 0.01.

