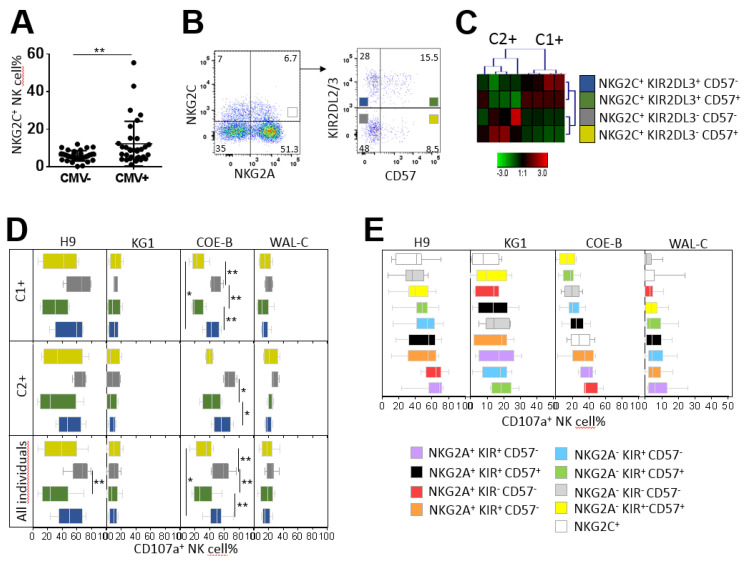
Figure 6.
Degranulation potential of CMV-driven NKG2C+ NK cell subsets against leukemia target cells. (A) Dot plots of NKG2C+ NK cell frequencies in CMV− (n = 32) and CMV+ (n = 36) individuals. (B) Density plots illustrating the cell strategy to target NKG2C+ NK cell subsets expressing or not expressing KIR2DL2/3 and CD57. (C) Heatmap (Genesis®) clustering of CMV+ blood donors with NKG2C NK cell amplification (n = 8) from the frequencies of the four NKG2C+ (KIR+ CD57+, KIR+ CD57−, KIR− CD57+ and KIR− CD57−) NK cell subsets. Each column is dedicated to a defined NK cell subset. The color of each square reflects the percentage of the corresponding subset. Red and green indicate high and low frequencies of NK cell subsets, respectively. (D) Whisker graphs of the degranulation of the four NKG2C+ NK cell subsets against ALL H9 and AML KG1 cell lines, primary ALL COE-B and AML WAL-C blasts for C1+ (n = 4), C2+ (n = 4) and all individuals (n = 8). (E) Whisker graphs of degranulation frequency of the nine investigated NK cell subsets from CMV+ individuals (n = 9) with amplification of the NKG2C+ NK cell subsets against H9, KG1, CO-E and WAL-C. NK cell subsets are classified from the highest to the lowest efficiency. p-values are indicated only where a significant p-value was obtained (p < 0.05). * Indicates p < 0.05 and ** indicates p < 0.01.

