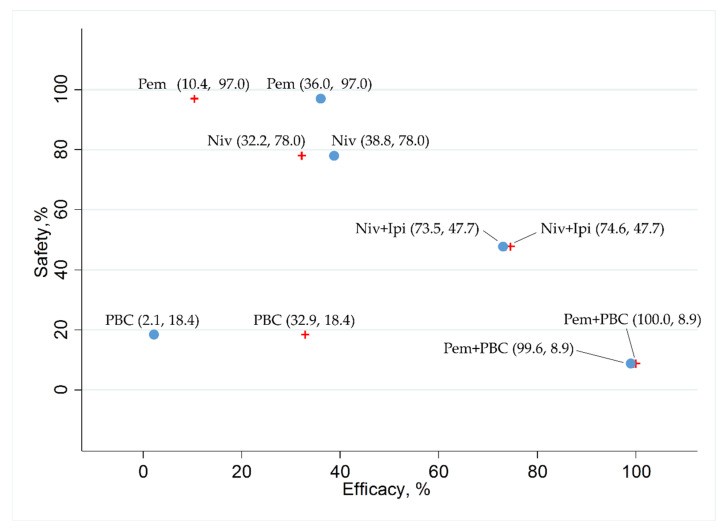
Figure 8.
The surface under the cumulative ranking curve (SUCRA) of the efficacy in progression-free survival (PFS) in a group of patients with programmed cell death ligand 1 (PD-L1) expression levels of 1% or more (presented as red crosses), in a group of patients with PD-L1 expression levels of 50% or more (presented as blue circles), and safety in any Grade 3–5 drug-related adverse events (G3–5AEs) in the overall population of the five therapeutic regimens (Niv+Ipi, Pem+PBC, Pem, Niv, and PBC). Data are presented as (SUCRA in PFS and SUCRA in G3–5AEs) with each plot of the five therapeutic regimens. In terms of efficacy in patients with PD-L1 expression levels of 1% or more (presented as red crosses), Pem+PBC ranked the highest, followed by Niv+Ipi, PBC, Niv, and, finally, Pem. In terms of efficacy in patients with PD-L1 expression levels of 50% or more (presented as blue circles), Pem+PBC ranked the highest, followed by Niv+Ipi, Niv, Pem, and, finally, PBC. However, Pem ranked the highest in safety, followed by Niv, Niv+Ipi, PBC, and, finally, Pem+PBC. Niv, nivolumab; PBC, platinum-based chemotherapy; Pem, pembrolizumab; Ipi, ipilimumab.

