Figure 7.
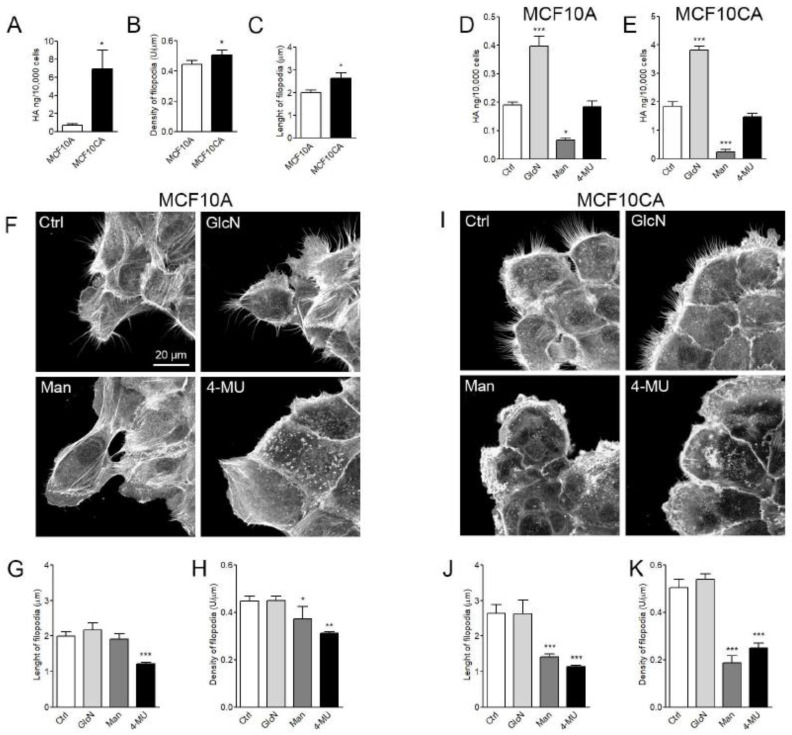
Hyaluronan (HA) secretion and filopodial growth in MCF10A and MCF10CA breast cancer cell lines. (A) HA secretion levels, (B) density, and (C) length of filopodia of fixed and phalloidin-stained MCF10 cell lines. Effect of different treatments on hyaluronan secretion of (D) MCF10A and (E) MCF10CA cells. (F) Examples of MCF10A cell cultures and (I) MCF10CA cell cultures after different treatments. (G) Average length and (H) density of filopodia in MCF10A cells, and (J) length and (K) density of filopodia in MCF10CA cells after different treatments. Ctrl = control, GlcN = glucosamine (2 mM), Man = mannose (20 mM), and 4-MU = 4-methylumbelliferone (1 mM). Student’s t-test was utilized to compare the cell lines (A–C) and one-way ANOVA compared the treatments (D, E, G, H, J and K). * p < 0.05, ** p < 0.01, *** p < 0.001 (n = 5 independent experiments with 18–43 cells/group in each experiment).

