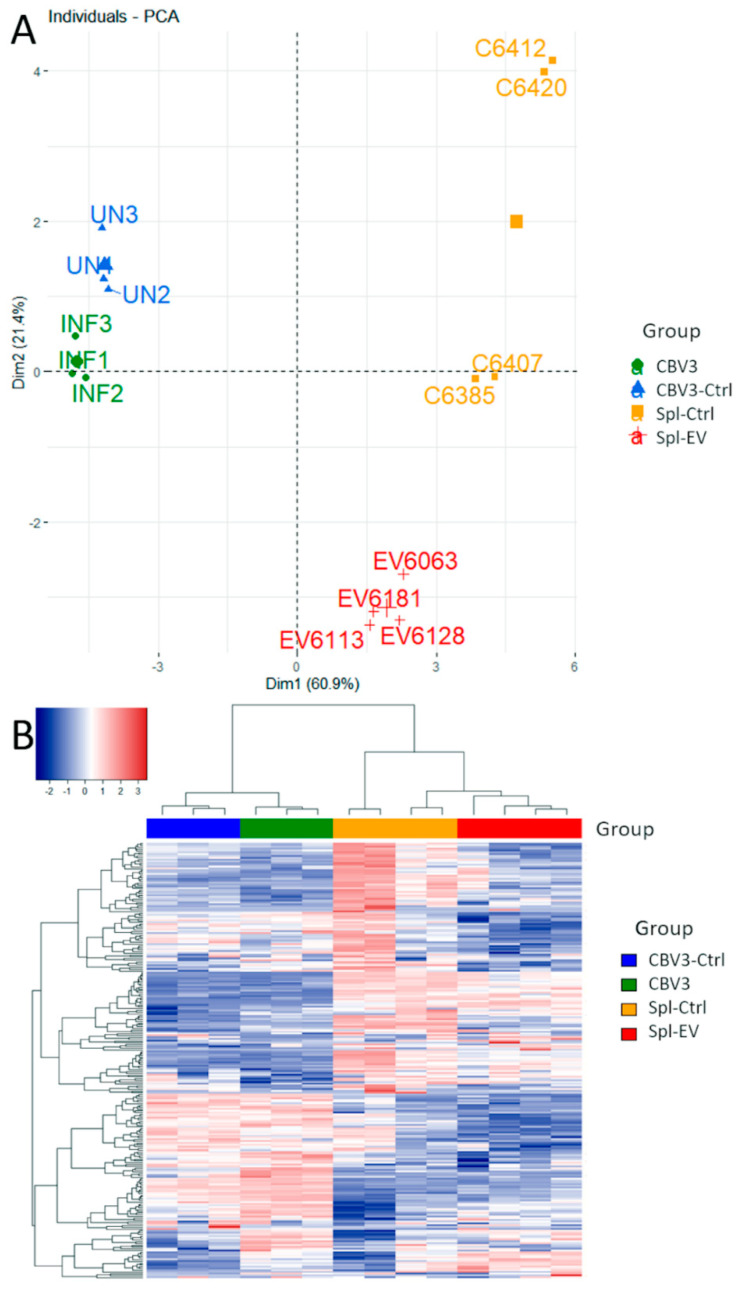
Figure 2.
Principal component analysis (PCA) and unsupervised hierarchical clustering of gene expression data. (A) Principal components 1 and 2 accounted for more than 80% of variation and clearly separated the four groups; (B) In the heatmap, hierarchical clustering produced two main groups belonging to the acute infection model (left hand-side, 3 + 3 lanes) and the slow infection model (right hand-side, 4 + 4 lanes). Within each group, the expression profiles of uninfected (left lanes) and infected (right lanes) samples can be compared.

