
Figure 3.
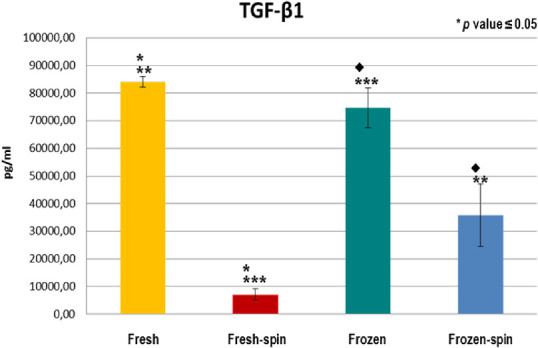
Concentration of TGF-β1 in E-PRP after the application of four procedures. **p ≤ 0.05 between the yellow group (fresh) and the blue (frozen-spin). ***p ≤ 0.05 between the red group (fresh-spin) and the green (frozen). ♦p ≤ 0.05 between the green group (frozen) and the blue (frozen-spin).