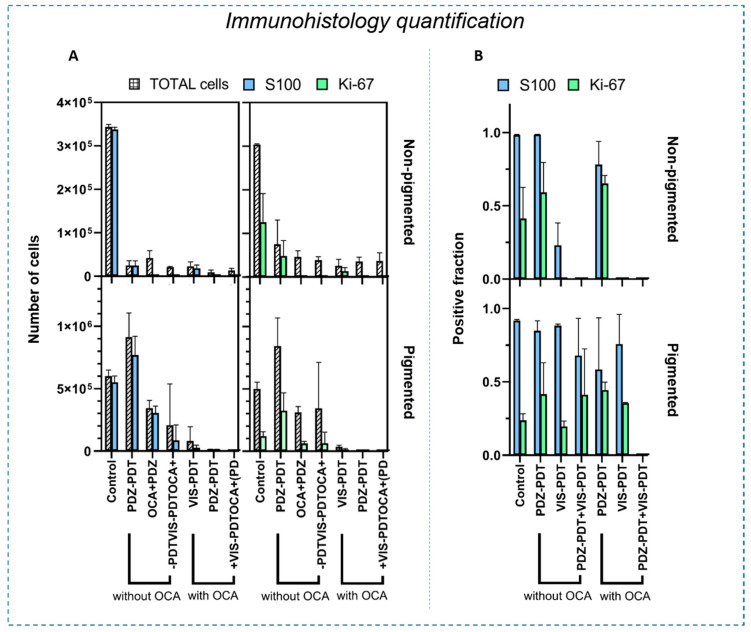
Figure 4.
Quantification of S100 and Ki-67 expression at 10 d after PDT, comparing pigmented and non-pigmented tumors. (A) Each panel shows the total number of cells and the number of positively stained cells for each of the treatment protocols. (B) Corresponding positive fractions, i.e., the ratio of positively-stained cells to total cells. Error bars indicate ± standard deviation.

