Figure 3.
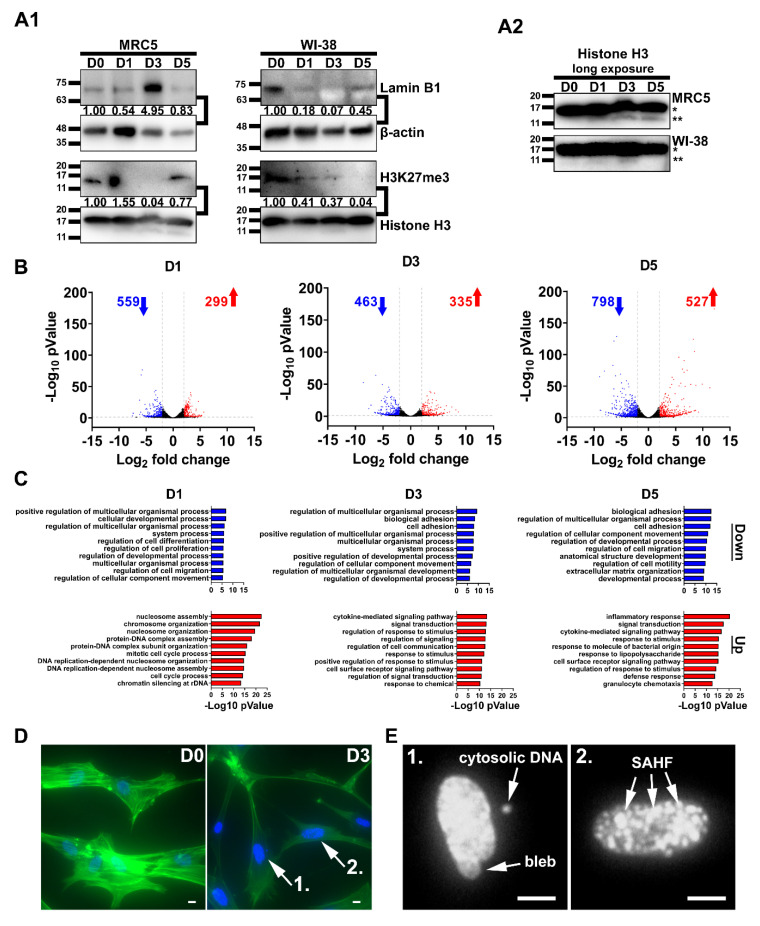
Dynamic chromatin remodeling and gene expression in SCM-induced senescence. (A1) Western blot showing the variation in lamin B1 and H3K27me3 levels in MRC5 and WI-38 cells over a five-day time course. The number below each band is the densitometry value (intensity ratio) compared to β-actin or histone H3 and relative to the control condition. (A2) Long exposure of Histone H3 loading control (* full-length Histone H3, ** cleaved). (B) Time course RNA-sequencing of MRC5 cells undergoing SCM-induced senescence. Volcano plots show differential gene expression between control (D0) and SCM-treated samples (D1, D3, and D5). The sequencing of RNA was performed in triplicate for each time point. The number of genes up- (red) and down-regulated (blue) are labeled on each plot. (C) GO enrichment analysis of transcriptome data. The up- (red) and down-regulated (blue) genes in the plots in B were all used in the analysis. The graphs show the top-10 biological processes affected by SCM conditions at each time point. (D) MRC5 cells stained for the nucleus (blue) and F-actin (green) at D0 and D3 (Scale Bar, 10 µm). (E) Nuclei labeled 1 and 2 from D are enlarged and presented in greyscale to show nuclear blebbing, cytosolic DNA, and SAHF (Scale Bar, 10 µm).

