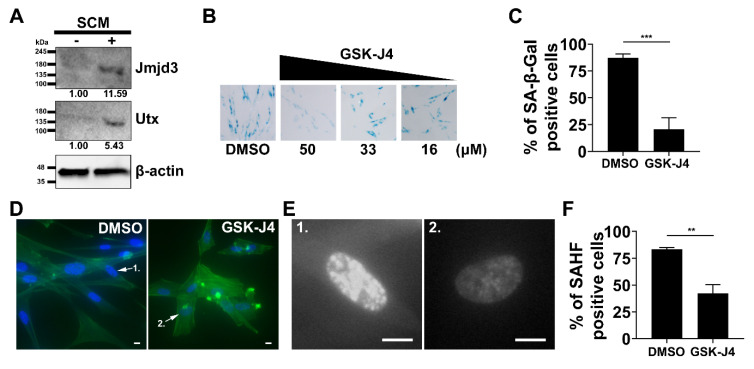
Figure 4.
Chemical inhibitor GSK-J4 blocks the effects of SCM. (A) Western blot showing Jmjd3 and Utx levels in MRC5 cell lysates after 48 h in SCM. The number below each band is the densitometry value (intensity ratio) compared to β-actin and relative to the control condition. (B) MRC5 cells simultaneously treated with SCM and GSK-J4 at different concentrations. Representative images for SA-β-gal staining at 48 h. DMSO was the vehicle control. (C) Quantification of SA-β-gal shown in B for 50 µM of GSK-J4 compared to DMSO. (D) Representative images MRC5 cells stained for the nucleus (blue) and F-actin (green). Cells were treated simultaneously with SCM and GSK-J4 (50 µM) for 72 h. (Scale Bar, 10 µm). (E) Cell nuclei 1 and 2 from D are enlarged and presented in greyscale (Scale Bar, 10 µm). (F) Quantification of cells with SAHF at 72 h. (C,F) Student’s t-test; bars represent standard deviation and asterisks indicate statistical significance (**, p ≤ 0.01; ***, p ≤ 0.001; n = 3).

