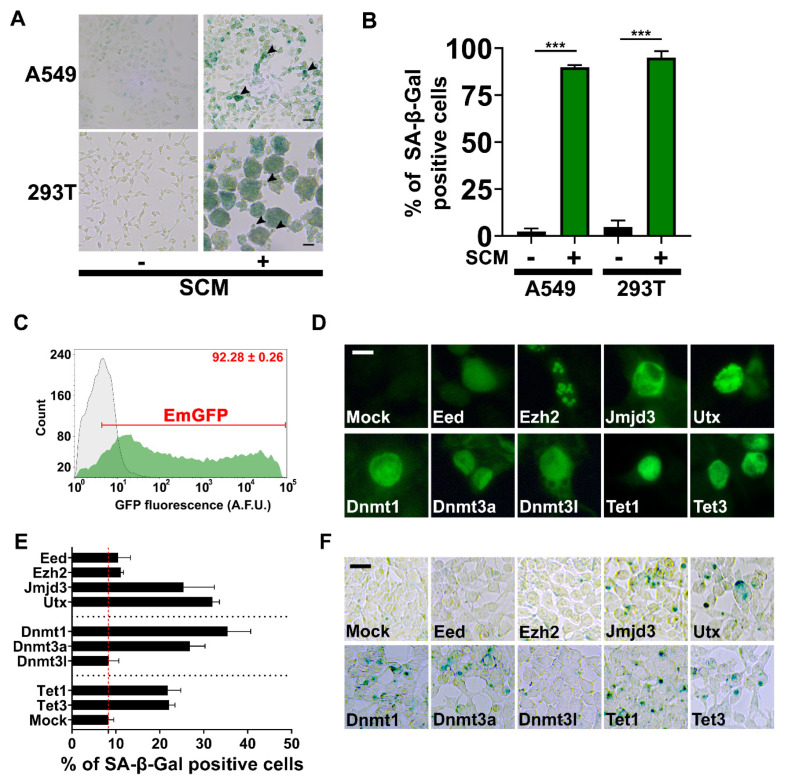
Figure 6.
Cancer stem cells and 293T cells overexpressing H3K27 demethylases display SA-β-gal+. (A) Representative images of A549 and 293T cancer stem cells stained for SA-β-Gal after seven days in SCM. Arrowheads point to anchorage-independent cells with SA-β-Gal+ (Scale Bars, A549 = 50 µm, 293T = 100 µm). (B) Quantification for SA-β-gal staining. Student’s t-test; bars represent standard deviation and asterisks indicate statistical significance (***, p ≤ 0.001; n = 3). (C) The mean transfection efficiency percentage of 293T cells was determined using a DNA construct encoding emerald green fluorescent protein (EmGFP). Cells were analyzed at 48 hr post-transfection by flow cytometry in triplicate. Flow cytometry histograms for transfected cells (green) and mock control (grey) are overlaid on the plot. The mean percentage of EmGFP+ cells was calculated using the gate limit setting of the mean fluorescence intensity of the mock control (number in the upper right corner in red is the percentage of EmGFP positive cells ± standard deviation). (D) Fluorescence microscopy images of transfected cells expressing the indicated proteins. Expression was detected by immunofluorescence staining (HA, FLAG, and c-myc fusion tags), followed by fluorescence microscopy (Scale Bar, 10 µm). (E) The graph shows the percentage of SA-β-gal+ at 48 hr post-transfection; mean ± SD were calculated from three different fields of view from images containing ≥300 cells. A mock transfection (no DNA) was the control. The red dashed line is equal to the mean value of the mock control for reference. (F) Representative bright-field images of SA-β-gal stained cells that were used for quantification in E (Scale Bar, 25 µm).

