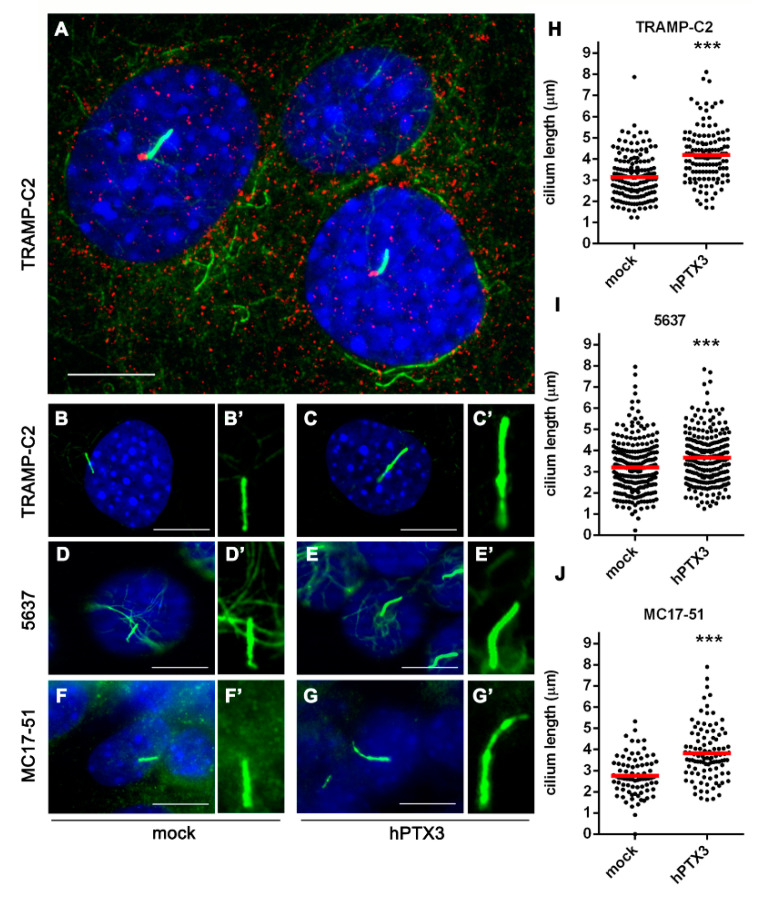
Figure 5.
PTX3 overexpression increases primary cilium length in different tumor cell lines. (A) Representative image of murine prostate TRAMP-C2 cells double immunostained with anti-acetylated α-tubulin (green) and anti-γ-tubulin (red) antibodies to visualize primary cilium axoneme and basal body, respectively. Nuclei were counterstained with DAPI (blue); (B–G’) representative images of primary cilium axoneme in mock (B,B’) and hPTX3 overexpressing (C,C’); TRAMP-C2 cells; mock (D,D’) and hPTX3 overexpressing (E,E’) human bladder carcinoma hPTX3-5637 cells; mock (F,F’) and hPTX3 overexpressing (G,G’) murine fibrosarcoma MC17-51 cells. Scale bar: 10 µm; (H–J) the length (µm) of acetylated α-tubulin+ cilia was measured in mock and hPTX3 overexpressing cells using the ImageJ software. Black dots represent individual cilia; red bars show the mean value. Data are from three independent experiments, *** p < 0.001, Student’s t-test.

