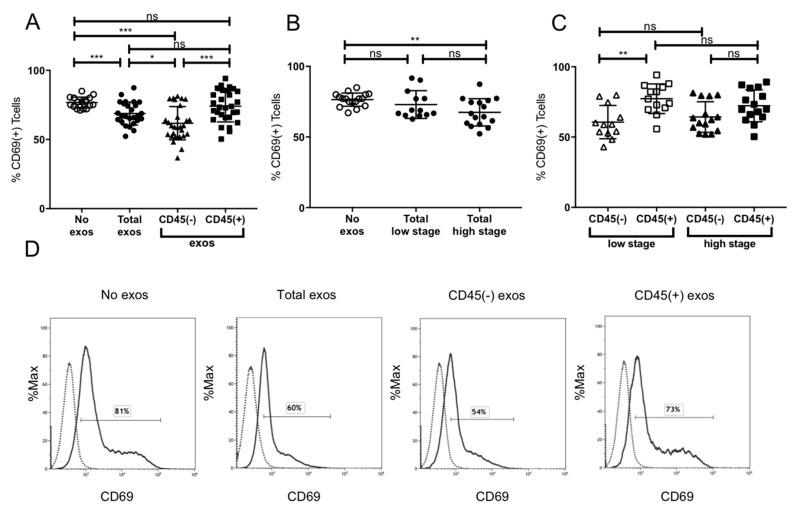
Figure 4.
CD69 expression by activated CD8+ T cells. (A) CD69 expression after incubation with total, CD45(−) and CD45(+) exosome fraction of patients of all stages (B) CD69 expression after incubation with total exosomes of low stage vs. high stage patients. (C) Incubation of CD8+ T cells with CD45(−) or CD45(+) exosomes of low or high stage patients.; n = 29. p values were determined with Mann-Whitney test, with * p < 0.05, ** p < 0.005, *** p < 0.0005. Bars represent mean with standard deviation (SD). (D) Representative flow cytometry histograms depicting CD69 levels on CD8+ T cells after incubation with phosphate-buffered saline (PBS), total, CD45(−), and CD45(+) exosomes (left to right) are shown. The solid line represents the CD69 signal, the dashed line represents the unstained control. The respective CD69 positive signal is displayed in percent.

