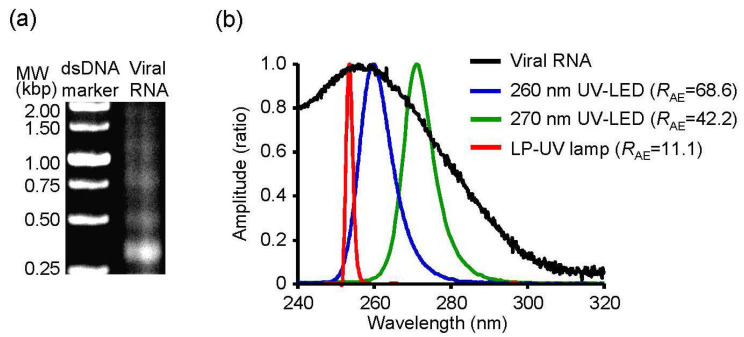
Figure 5.
Absorbance spectrum of viral RNA and emission spectrum of UV irradiations. (a) A representative image of agarose gel electrophoresis for purified viral RNA. (b) Absorbance spectrum of viral RNA and emission spectrum of UV irradiations. RAE score indicates the correlation coefficient between the absorbance spectrum of viral RNA and emission spectrums of UV irradiations.

