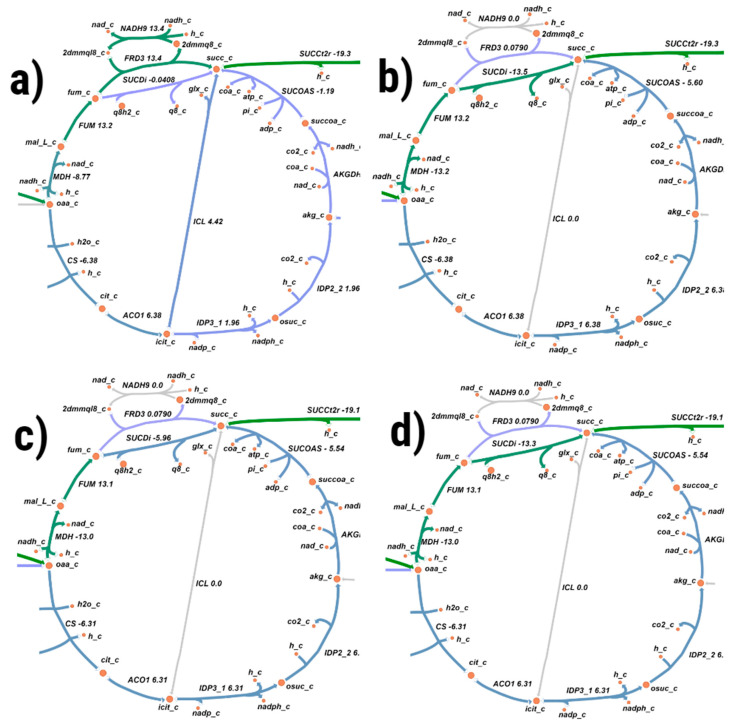
Figure 1.
The flux distribution maps for TCA cycle predicted by iMK1321 for growth of Geobacillus icigianus on: (a) glucose, (b) glycerine, (c) xylose, (d) arabinose. The maps were drawn in Escher web-tool, where the circles represent metabolites, while the arrows refer to reactions [27]. The flux value through the reaction is reflected by colour, where numbers represent corresponding range of the reaction fluxes in mmol gDCW−1 h−1: purple—0–1; blue—5–10; green—10–30; red—30–80 mmol gDCW−1 h−1.

