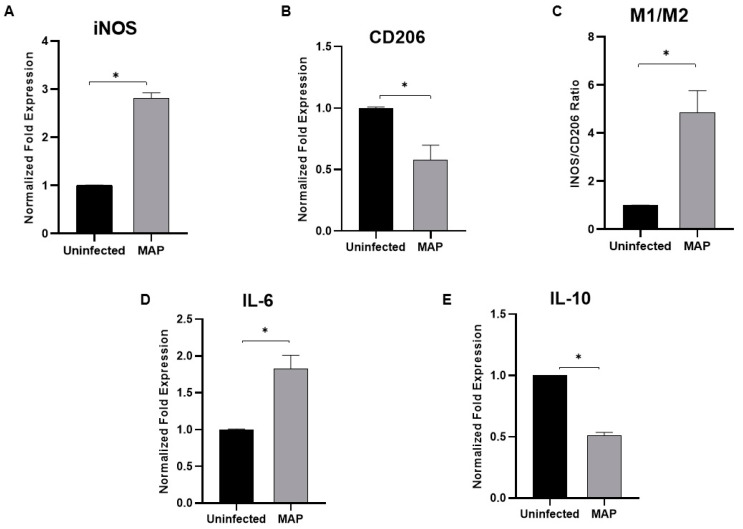
Figure 6.
Effect of MAP infection on macrophage polarization and phenotypic response. THP-1-derived macrophages were infected with MAP (UCF 4, 107 CFU/mL) for 24 h. Expression levels of iNOS (A), CD206 (B), IL-6 (D), and IL-10 (E) were measured using RT-PCR. M1/M2 ratio was determined by calculating the expression ratio of iNOS/CD206 (C). All experiments were performed in triplets. Data are shown as mean ± SD, and significance is considered as * p < 0.05.

