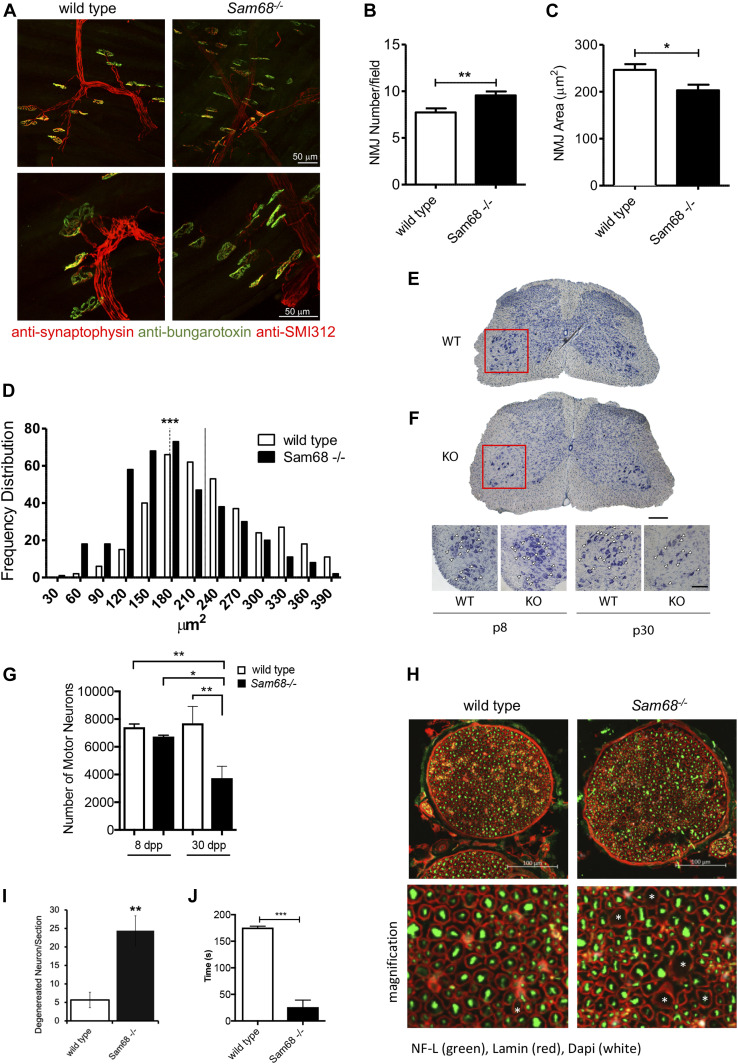
Figure 2. Sam68 deficiency affects motor neurons upon postnatal muscle development.
(A) NMJ immunofluorescence images from tibialis anterior (TA) of 30-dpp Sam68−/− and control mice. Postsynaptic (AChRs stained with α-bungarotoxin; green), presynaptic (stained with α-synaptophysin; red), and motor neuron axons (stained with an antibody against the heavy chain of neurofilament; red) were visualized. Scale bars: 50 μm; magnification: 40× (upper panels) and 80× (lower panels). (B) Bar graph showing the number of NMJs from TA of 30-dpp Sam68−/− and control mice (n = 3; mean ± SEM). P-value was determined by t test (**P < 0.01). (C) Bar graph showing the area of NMJs from TA of 30-dpp Sam68−/− and control mice (n = 3; mean ± SEM). P-value was determined by t test (*P < 0.05). (D) Frequency distribution of the NMJs areas from TA of 30-dpp Sam68−/− and control mice. The colored lines and dotted line (Sam68−/− mice) represent the median value for each genotype: wild type (n = 3), median size = 223 μm2, Sam68−/− (n = 3) median size = 181 μm2; statistical analysis of the median values was performed by one-way ANOVA test. (E) Representative image of a Nissl-stained spinal cord section of the lumbar spinal cord from 30-dpp WT and KO mice. The red square highlights the ventral horn of the spinal cord analyzed. Bar, 200 μm. (F) Higher magnification of sections of the ventral lumbar spinal cord from 8- to 30-dpp WT and Sam68 KO mice. Motor neurons are indicated by arrowheads. Bar, 100 μm. (F, G) Bar graph representing motor neuron counts (mean ± SEM; n = 3) in lumbar spinal cord from mice described in (F). Statistical analysis was performed by two-way ANOVA test followed by Bonferroni’s multiple comparison post-test (*P < 0.05, **P < 0.01). (H) Representative images of sciatic nerve from 45 dpp WT or KO mice, stained with neurofilament (in green) and Laminin (in red); DAPI was used for the staining of the nuclei. (I) Bar graphs representing the number of degenerated neurons per sections from three independent experiments. P-value was determined by t test (**P < 0.01). (J) Bar graphs represent time (s) in hanging-wire test of 45-dpp wild-type and Sam68−/− mice; (WT n = 7, Sam68−/− n = 7). Data are shown as mean ± SEM. P-value was determined by t test (***P < 0.001).

