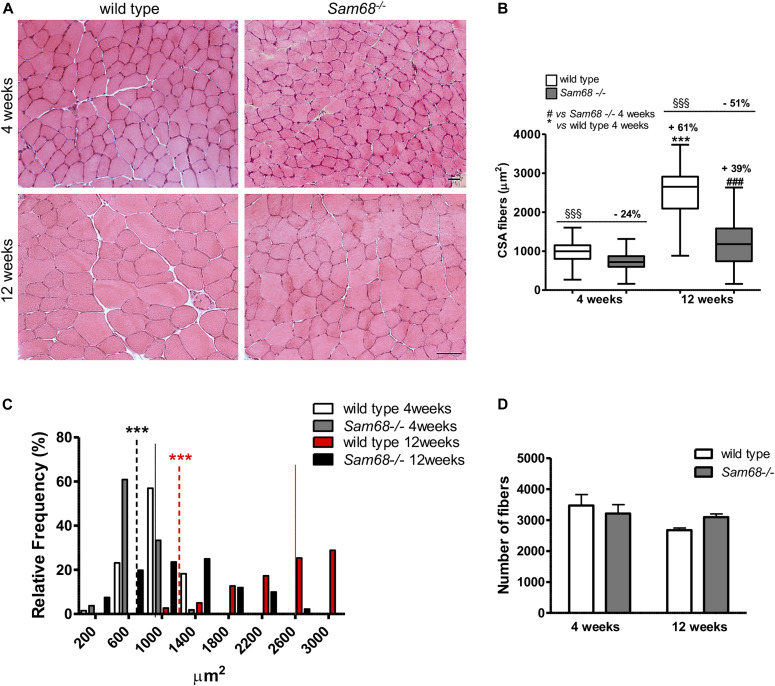
Figure 4. Sam68−/− muscles display defects in postnatal muscle development.
(A) Hematoxylin and eosin (H&E) staining of muscle cross sections from the tibialis anterior (TA) muscle of 30- and 90-d-old mice and control mice; scale bar: 50 μm; magnification: 20×. (B) Quantification of the cross-sectional area of muscle fibers in TA muscle of 30- and 90-d-old Sam68−/− and control mice. Individual data points represent means ± SEM (n = 3); one-way ANOVA (***P < 0.001 versus wild-type 4 wk; ###P < 0.001 versus Sam68−/− 4 wk; §§§P < 0.001 versus relative wild-type control). (C) Frequency distribution of muscle fibers areas from TA of 4 and 12 wk Sam68−/− and control mice. The colored lines (wild type) and dotted line (Sam68−/− mice) represent the median value for each genotype: wild-type 4 wk (n = 3) median size = 996 μm2, Sam68−/− 4 wk (n = 3) median size = 720 μm2, wild-type 12 wk (n = 3) median size = 2,651 μm2, Sam68−/− 12 wk (n = 3) median size = 1,180 μm2; individual data points represent means ± SEM (n = 3); one-way ANOVA (***P < 0.001). (D) Quantification of the number of muscle fibers in TA muscle of 30- and 90-d-old mice and control mice. Individual data points represent means ± SEM (n = 3).

