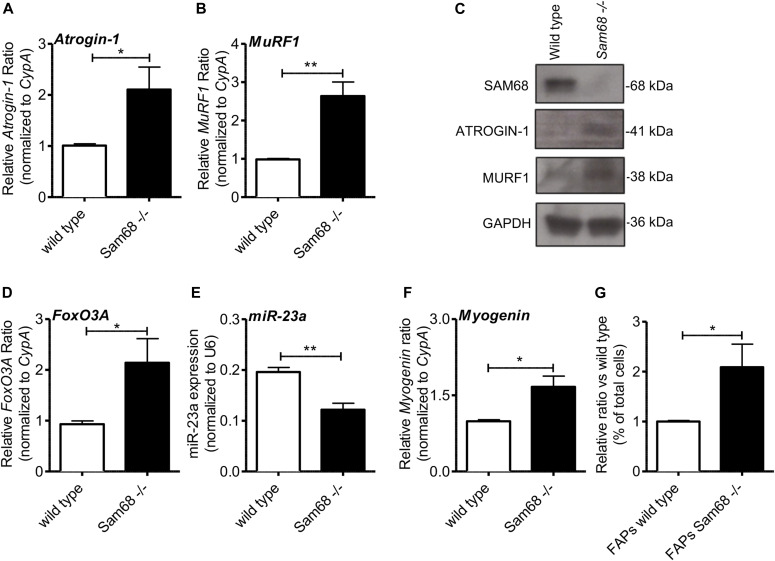
Figure 5. Sam68 deficiency induces up-regulation of atrogin-1 and MuRF1.
(A) RT-qPCR analysis showing the levels of atrogin-1 and MuRF1 transcripts in tibialis anterior (TA) of 30-d-old mice normalized for the levels of the housekeeping gene CypA (n = 5; means ± SEM); P-value was determined by t test (*P < 0.05, **P < 0.01). (B) RT-qPCR analysis of miR-23a expression levels in TA of 30-d-old mice normalized for the levels of the housekeeping gene U6 (n = 5; means ± SEM); P-value was determined by t test (**P < 0.01). (C) Western blot analysis for SAM68, ATROGIN-1, and MURF1 proteins using TA muscle of 30-d-old mice. GAPDH is shown as a loading control. (D) RT-qPCR analysis of FoXO3A mRNA levels in TA of 30-d-old mice normalized for the levels of the housekeeping gene CypA (n = 8; means ± SEM); P-value was determined by t test (*P < 0.05). (E) RT-qPCR analysis of miR-23a expression levels in TA of 30-d-old mice normalized for the levels of the housekeeping gene U6 (n = 5; means ± SEM); P-value was determined by t test (**P < 0.01). (F) RT-qPCR analysis of myogenin mRNA levels in TA of 30-d-old mice normalized for the levels of the housekeeping gene CypA (n = 8). Individual data points represent means ± SEM; P-value was determined by t test (*P < 0.05). (G) Bar graph shows the percentage of fibro-adipogenic progenitors, analyzed by flow cytometry, from the whole hind limbs muscles of 60-dpp Sam68−/− and control mice (mean ± SEM; n = 4); P-value was determined by t test (*P < 0.05).

