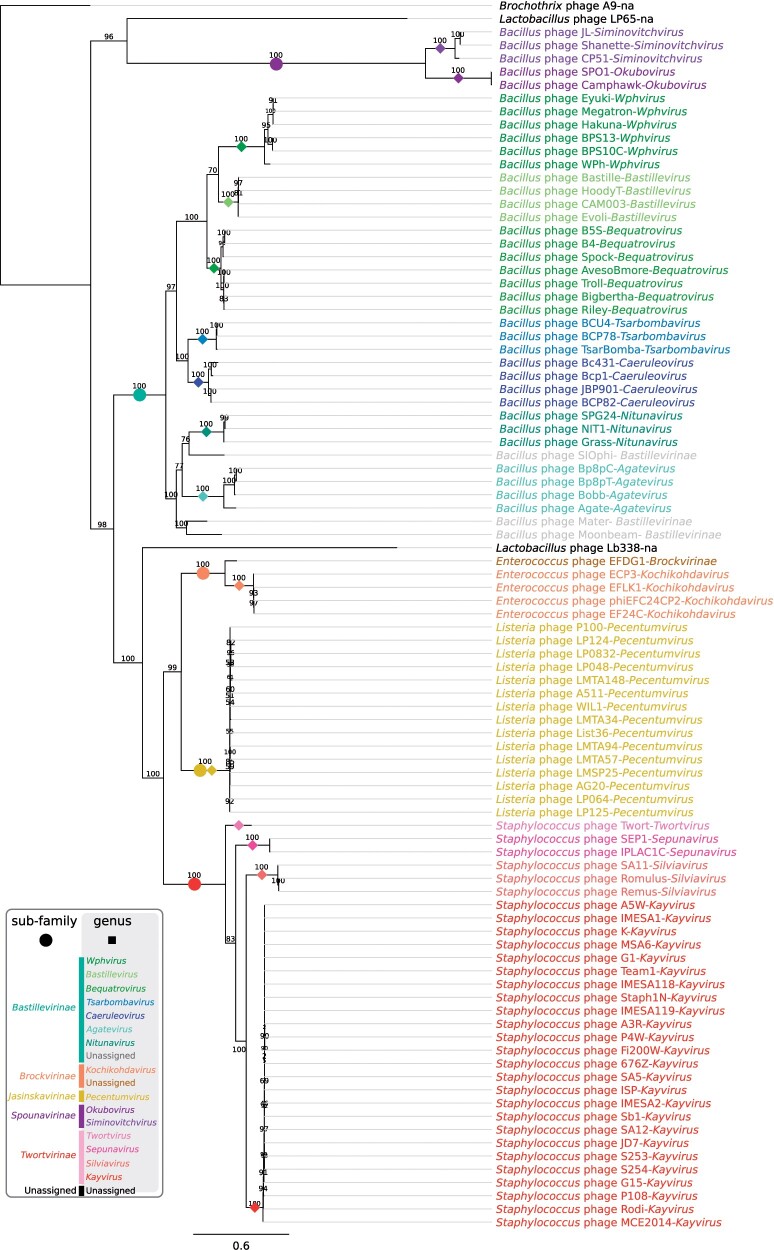
Figure 4.
Maximum-likelihood tree based on concatenated alignment of 10 marker proteins generated using IQ-tree. The scale bar represents the number of substitutions per site, branch support values were calculated from 1000 ultrafast bootstrap (UFBOOT) replicates. The trees were rooted at Brochothrix phage A9 to facilitate comparison. Branches corresponding to genera and subfamilies are delineated with colored squares and circles, respectively.

