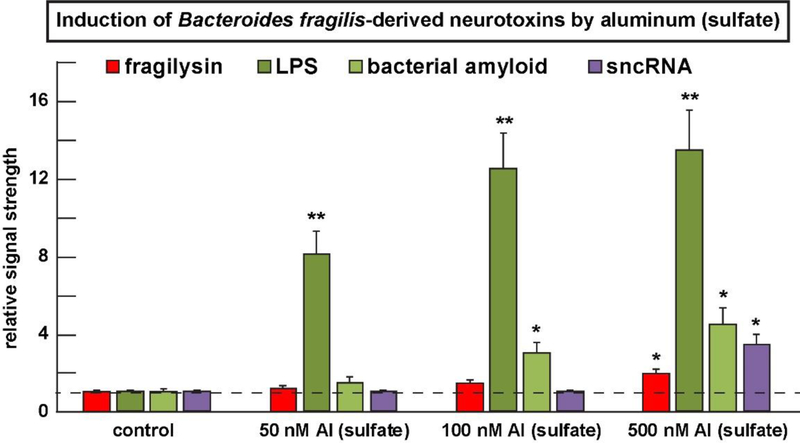
FIGURE 3 -.
The human GI-tract microbiome-resident Bacteroides fragilis (B. fragilis) produces an array of soluble neurotoxins (such as fragilysin, LOS, LPS, bacterial amyloid, sncRNA and others) that are secreted into their immediate environment (see text); many of these neurotoxins are known to cross both the GI-tract intestinal barrier into the systemic circulation and induce a systemic inflammation; some of these neurotoxins may cross the blood brain barrier (BBB) to access the brain parenchyma in the aging human BBB or in transgenic murine models for AD and other neurodegenerative disease states [39,51,57–62]. All of these GI-tract microbiome-derived neurotoxins and especially lipopolysaccharide (LPS) are induced by nM levels of aluminum sulfate in B. fragilis cultures; interestingly (i) the increase in LPS at 50 nM aluminum sulfate is not proportionate to increases in LPS at 100 nM and 500 nM aluminum sulfate suggesting that the system may become rapidly saturated at the relatively lower concentrations of applied aluminum sulfate; and (ii) at higher concentrations of aluminum sulfate (~500 nM) in this system other B. fragilis-secreted neurotoxins such as fragilysin, bacterial amyloid and sncRNA become induced above basal levels and the results are significant; while aluminum itself is pro-inflammatory as measured by its ability to induce the pro-inflammatory transcription factor NF-kB (p50/p65) complex [26–28], aluminum-mediated induction of LPS and other inflammation-supporting neurotoxins such as LPS may also contribute to the pro-inflammatory actions of aluminum-sulfate in both the human GI-tract and the human CNS [42,43,56]. Aluminum-induced up-regulation of microbiome-derived LPS may also contribute to systemic inflammation but this pathological mechanism is not well understood and requires further study; in Figure 3 a dashed horizontal line at 1.0 is included for ease of comparison; N=3 to 5 experiments per determination; data in the bar graph represents the mean and one standard deviation of that mean; *p<0.05; **p<0.001 (ANOVA).

