Figure 2.

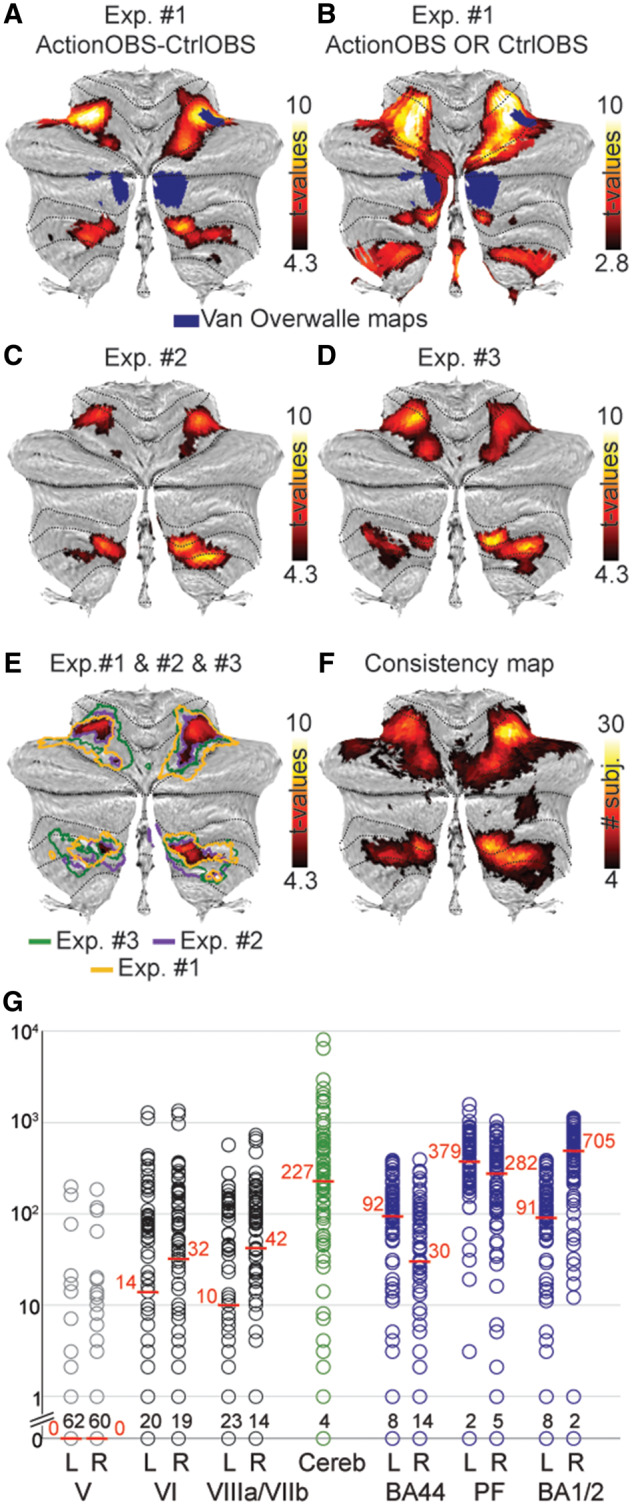
Reliability of cerebellar action observation activations. (A and B) In blue the maps presented by Van Overwalle et al. (2014), and the results of the ActionOBS–CtrlOBS contrast of Experiment 1 in the hot colour scale in (A) and of the global null conjunction ActionOBS OR CtrlOBS for Experiment 1 in (B), both at PFWE < 0.05. (C and D) ActioOBS–CtrlOBS related activity for Experiments 2 and 3, respectively. PFWE < 0.05, t = 4.3. (E) Activations common to Experiments 1–3. Yellow, blue and green contours indicate the borders of the clusters shown in A, C and D to facilitate the qualitative comparison. (F) Consistency map computed on the smoothed data for the ActionOBS–CtrlOBS (Punc < 0.001, t = 3.1) contrast across the three experiments. The hot scale indicates the number of participants for which a particular voxel was significantly activated by the ActionOBS–CtrlOBS contrast. (G) Circles indicate the number of significant voxels a given subject had in each of the four cerebellar clusters of interest (black), in the control lobule V (grey), in total in the cerebellum (green), and in three cortical regions also commonly activated by the ActionOBS–CtrlOBS contrast (blue). The median is indicated by the red lines and numbers. Data are presented on a logarithmic scale and the number of participants having no voxels in a particular cluster is indicated in black on the x-axis.
