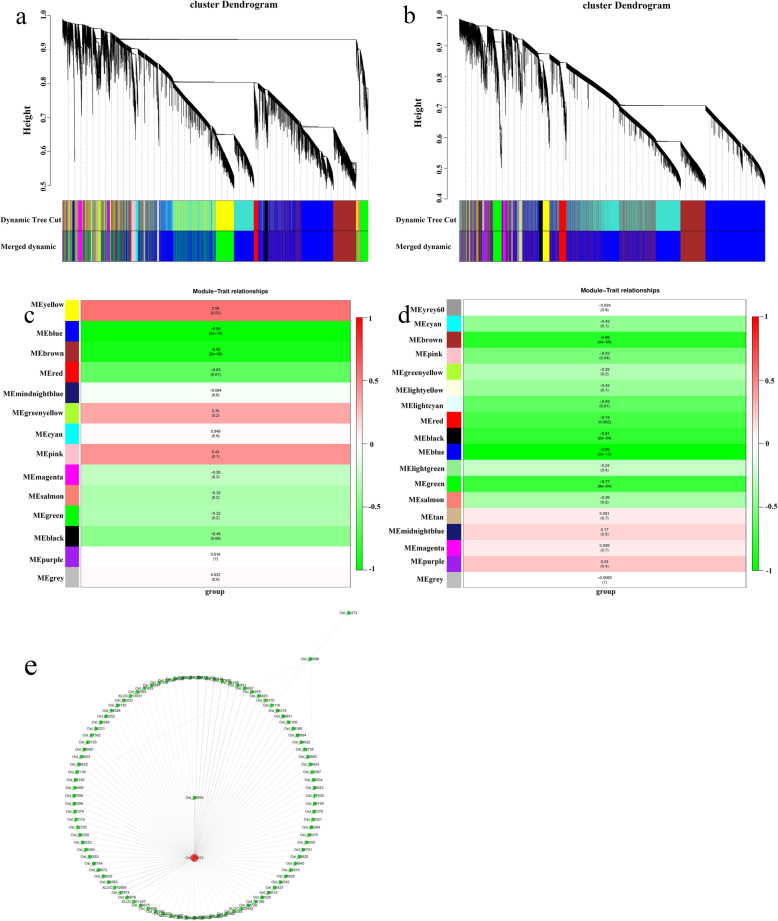
Fig. 6.
Weighted gene co-expression network analysis (WGCNA) of DEGs identified from 253 and Y12–4 after cold stress. a Hierarchical cluster tree showing 18 modules of co-expressed genes in 253. Each of the DEGs is represented by a tree leaf and each of the modules by a major tree branch. The lower panel shows modules in designated colours. b Hierarchical cluster tree showing 14 modules of co-expressed genes in Y12–4. Each of the DEGs is represented by a tree leaf and each of the modules by a major tree branch. The lower panel shows modules in designated colours. c Module trait relation in Y12–4 and 253. Each line represents a gene module. The number in each Module represents the correlation between modules and traits. The value near to 1, the positive correlation between modules and traits is stronger. The value near to − 1, the negative correlation between modules and traits is stronger. The number in brackets represents the significance P value, and the value is smaller, the significance of correlation between traits and modules is stronger. d Network of CBF2 and related genes in greenyellow module in Y12–4. Osl_21453 is number of CBF2. Osl_20698 is number of LTG5. Every number is represents one gene

