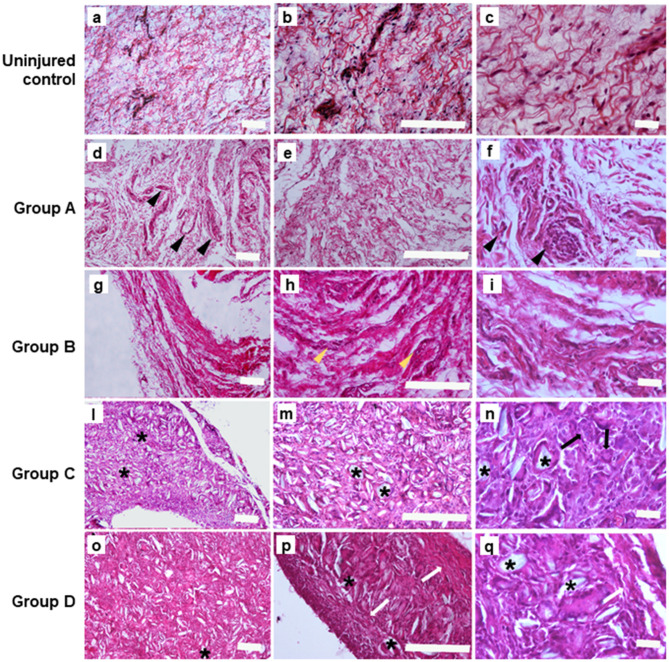
Figure 2.
Hematoxylin&Eosin staining performed on the samples at 4 weeks. (A–C) Uninjured lesions (Scale bars: a, b 100 μm; c 20 μm); (D–F). Group A: control lesions obtained only by incision and milling, note the presence of leucocytes (pointed arrow) (Scale bars: d, e 100 μm; f 20 μm); (G–I). Group B: lesions obtained by incision an injection of 16 mg/ml of talc (Scale bars: g, h 100 μm; i 20 μm); in (H) yellow pointed arrows depict the reactive vascular component; (L–N). Group C: lesions obtained by incision with 160 mg/ml of talc injection; note the presence of talc crystal (*) and multigiant cells (->) (Scale bars: l, m 100 μm; n 20 μm); (O–Q). Group D: Lesions obtained by incision with injection of and 300mg/ml of talc, note the presence the presence of fibrotic capsule (white arrow) around the talc residuals (*) (Scale bars: o, p 100 μm; q 20 μm).

