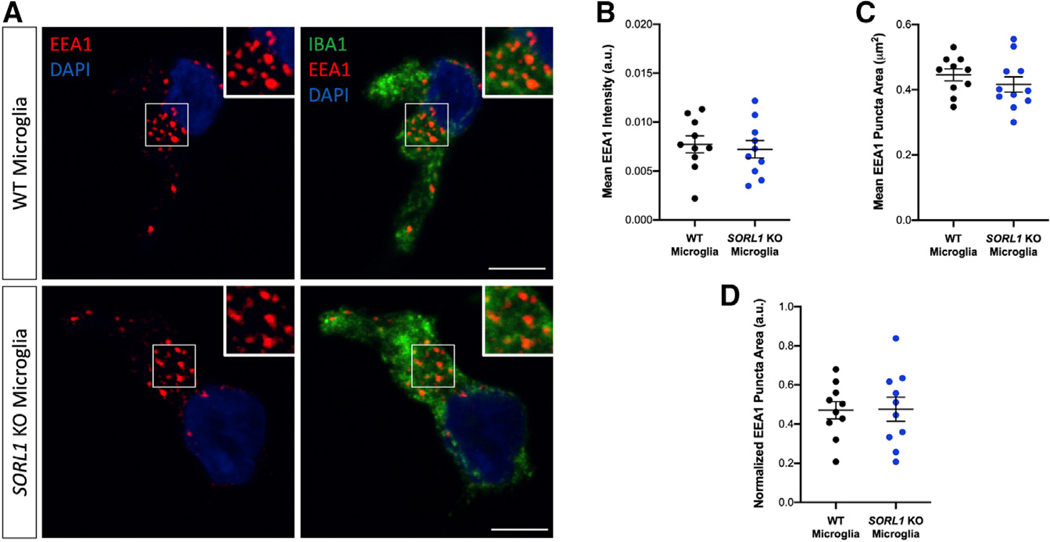
Figure 2. Depletion of SORL1 Does Not Lead to Enlarged Early Endosomes in hiPSC Microglial-like Cells.

(A) Representative immunofluorescence images of WT and SORL1-KO microglial-like cells stained with EEA1 (red), Iba1 (green), and DAPI (blue). White boxes indicate regions of interest (ROIs) magnified in insets. Scale bars, 5 μm.
(B) Quantification of immunofluorescence images demonstrates no significant change in mean EEA1+ puncta intensity in SORL1-KO microglial-like cells compared with WT. n = 10 images (10–14 cells).
(C) Quantification of immunofluorescence images demonstrates no significant change in EEA1+ puncta area in SORL1-KO microglial-like cells compared with WT. n = 10 images (10–14 cells).
(D) Normalization of mean EEA1+ puncta area by cell area in WT compared with SORL1-KO microglial-like cells. n = 10 images (18–22 cells). All experiments represent two isogenic clones of each genotype (four total). Normally distributed data (B–D) were analyzed using two-tailed unpaired t tests and found non-significant (ns).
