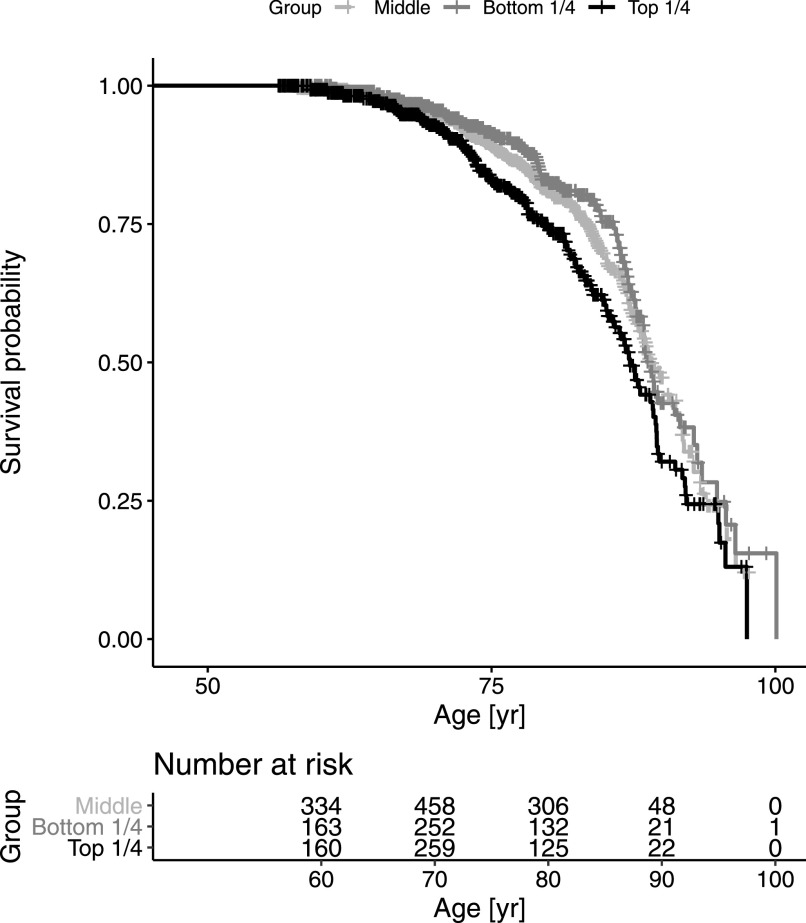
Figure 3. Survival analysis comparing upper and lower quarters of histidine-rich glycoprotein levels.
The individuals of sample set 3 were divided into four subsets by the quartiles of histidine-rich glycoprotein levels. Differential mortality across follow-up time is illustrated by the survival curves, where age was used as the time scale (Thiébaut & Bénichou, 2004). The number at risk at 10 yr intervals were displayed below the survival curve. Some detailed statistics related to this survival analysis are presented in Table S4.

