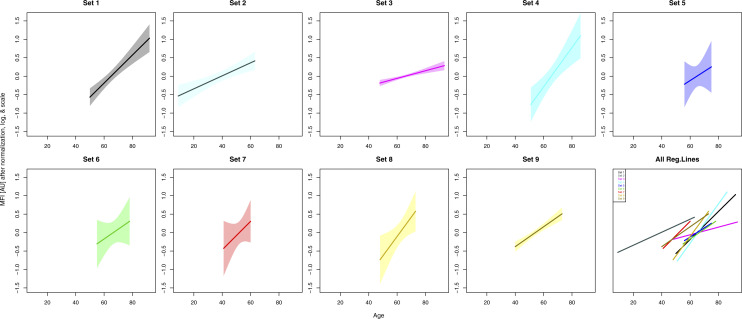
Figure S2. Protein profiles of HPA045005 in every sample set.
The solid lines illustrate the trends estimated by linear regression, and the shades around them show 95% confidence intervals of fitted values. At the bottom right corner, all trend lines were overlapped to present the increasing trends in all nine sample sets.

