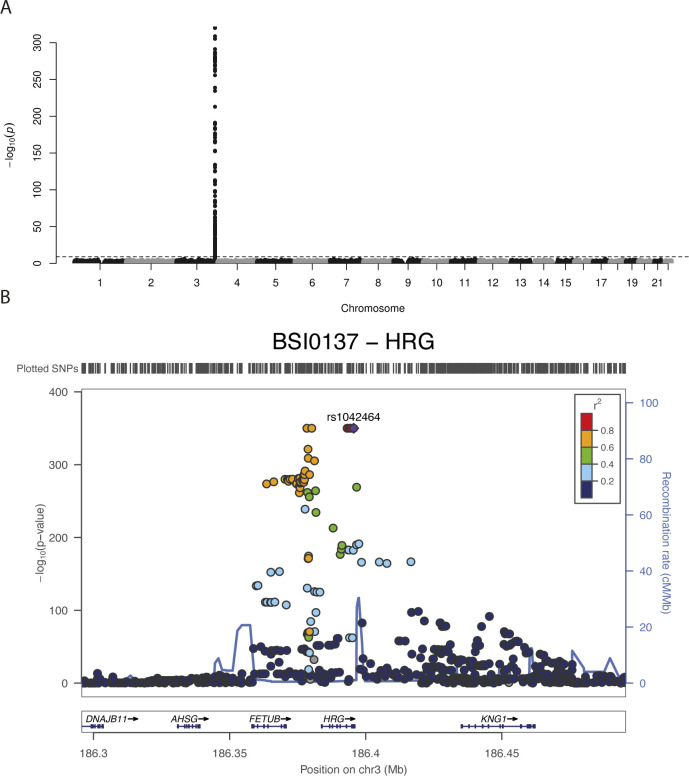
Figure S4. Manhattan plot and LocusZoom plot for BSI0137 antibody profile.
Because the P-values of the top single-nucleotide polymorphisms in the genome-wide association study for BSI0137 was too low, the computation tool for this analysis, PLINK, gave us 0 s. (A, B) The values were manually set to the lowest values the visualization software allowed, 1 × 10−320 in (A) or 1 × 10−350 in (B).

