
Figure S5. Probabilistic identification of causal SNPs (PICS) analysis for the associated single-nucleotide polymorphisms with HPA045005 and BSI0137.
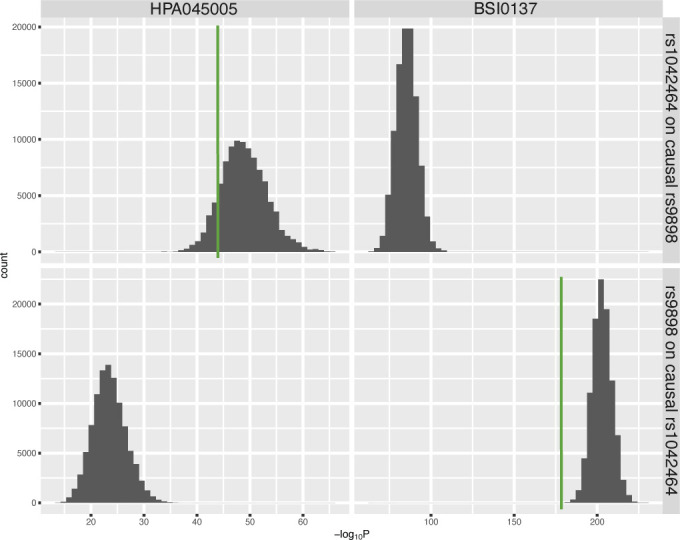
The top two figures display the distribution of -log of P-values obtained from the linear regression model for the effects of the genotype of rs1042464 in 100,000 permutations, assuming rs9898 was causal for individual antibody profiles. The bottom figures show the results of rs9898 assuming rs1042464 was causal genetic variant. The green vertical lines indicate the observed significances.