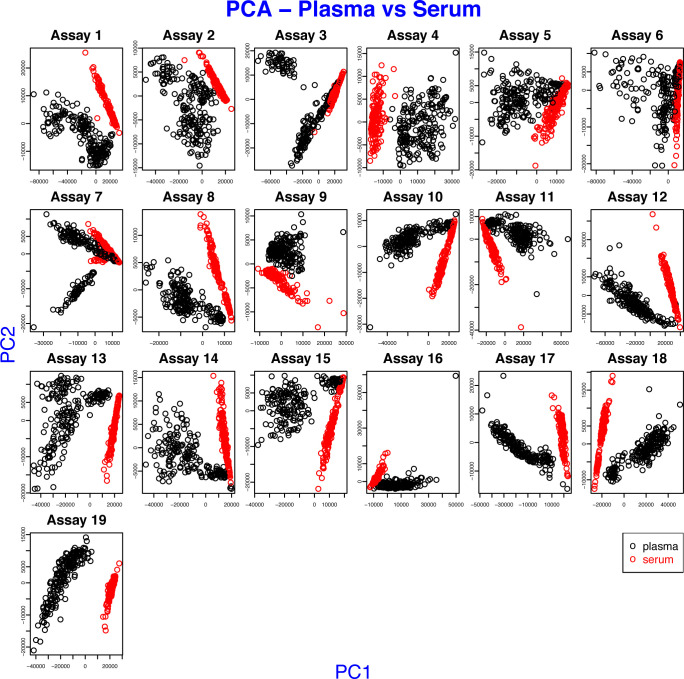
Figure S9. Difference between serum and plasma in sample sets 1 and 2.
Each plot displays the first two principal components of the MFIs of one assay, where the profiles of a set of 384 antibodies were obtained. The points of the scatter plot were colored by sample preparation types, such as plasma and serum.

