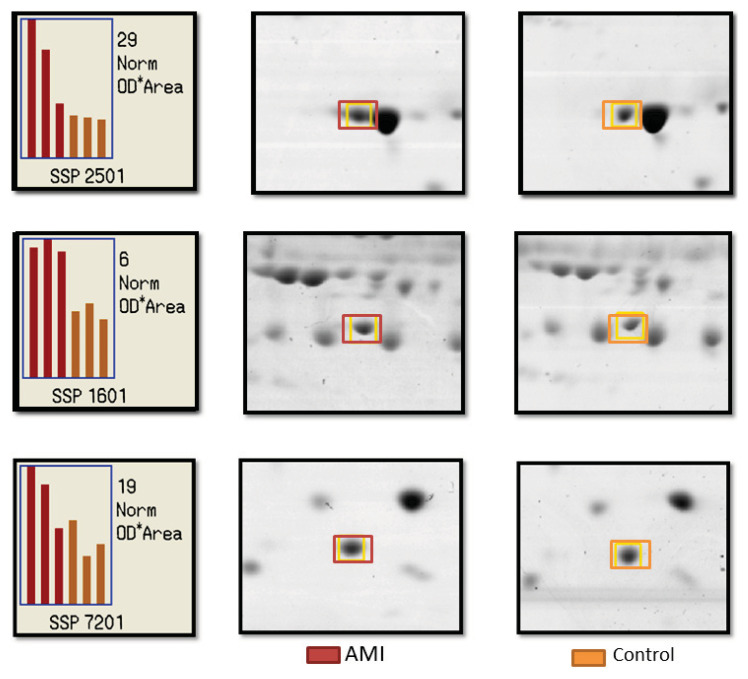
Figure 1.
Representative patterns of protein spots that were differently expressed in young AMI patients as compared to the controls, recognised as SSP 2502, SSP 1601 and SSP 7201. The spots in the 2-dimentional electrophoresis gels of pH 4–7 were examined and analysed using the PD Quest 7.2.0 software. The graph corresponds with the intensity of the protein in three gels for each group in terms of optical density (OD).
Note: Red bars denote data from the AMI group while orange bars denote data from control group

