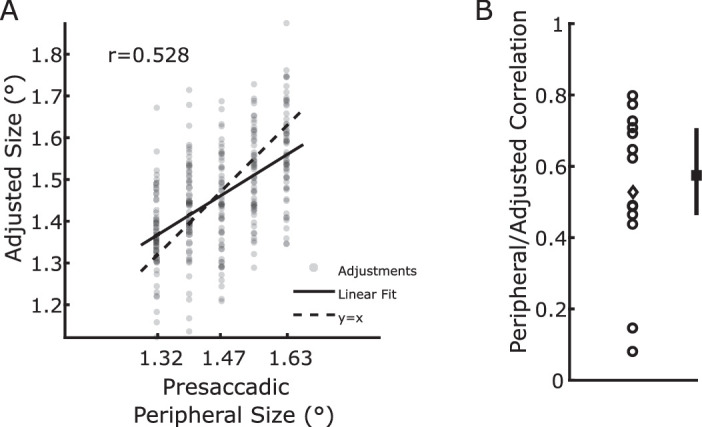
Figure 2.

(A) Example of correlation between presaccadic peripheral size and adjusted size in one example observer. Each point represents one trial. (B) Correlation coefficients for all observers. Each circle represents one observer, the diamond represents the participant whose data are plotted in panel (A). The solid line represents the median, first quartile, and third quartile. Except for two observers, the correlation is relatively high, suggesting that most observers were able to perform the task. The data from the two observers who had correlations below 0.2 have been discarded before subsequent analyses.
