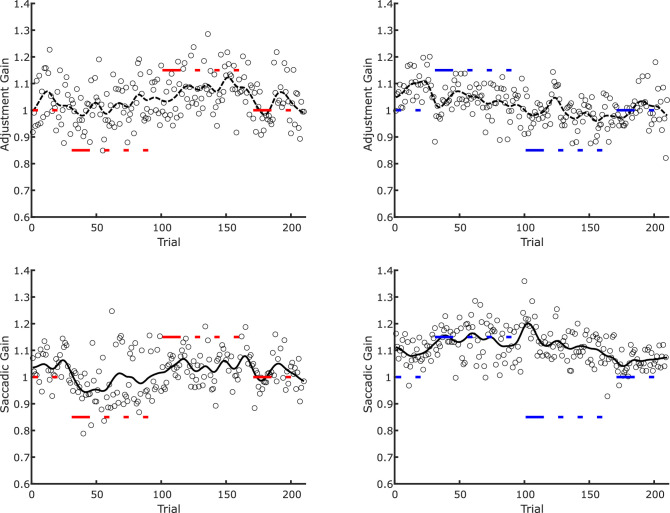
Figure 6.
Examples of raw data in Experiment 2. Top panels: adjustment gain in trans-saccadic recalibration trials. Bottom panels: saccadic gain in the saccade adaptation trials. Left panels: decrease-increase and inward-outward sessions. Right panels: increase-decrease and outward-inward sessions. Black dots represent individual adjustments/saccade amplitudes in one given trial. The black lines represent the smoothed (Gaussian kernel with SD = 4 trials) time course. The thick red and blue horizontal lines represent the gain of the trans-saccadic change (size or position) in the respective trials. The interruptions in the red and blue lines denote test trials in which either no saccade was executed, or the stimulus disappeared during the saccade.

