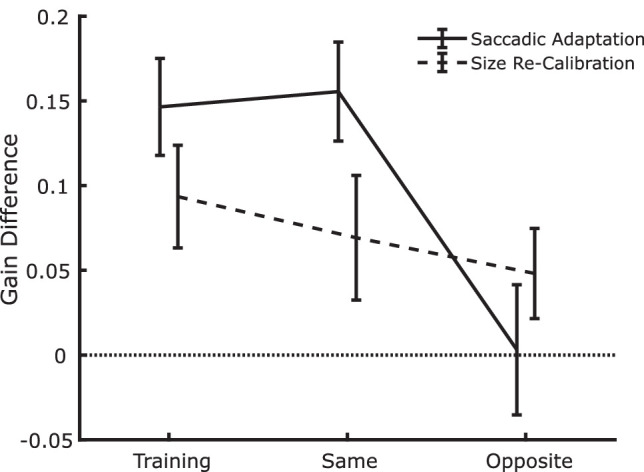
Figure 8.

Summary plot indicating the strength of size recalibration and saccadic adaptation computed as the difference in gain between the trials in which the trans-saccadic change was increase/outward and the trials in which it was decrease/inward. Data are plotted as a function of the type of trial (training, test at the same location, test at the opposite location). The results clearly show an interaction in which the gain difference is positive (as expected) in each case, except at the opposite location for saccadic adaptation. Error bars are between-observer SEM.
