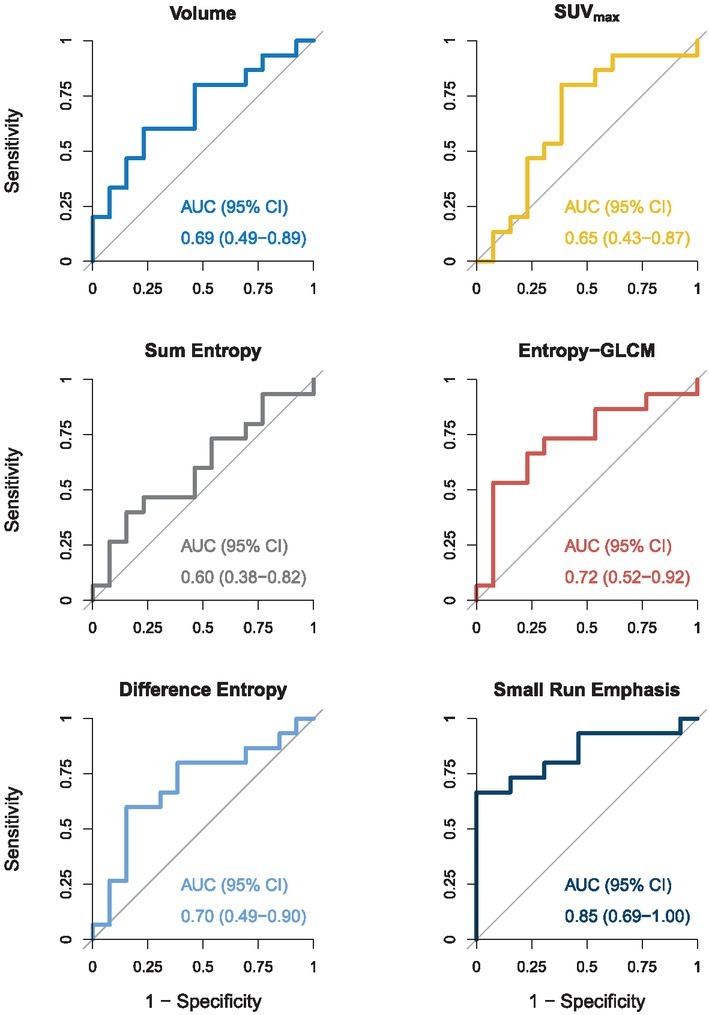
Figure 1.

Baseline radiomics features of primary tumours – Receiver operating characteristic curve (ROC) analysis. For each radiomics feature, the area under the ROC curve (AUC) with the corresponding 95% confidence interval (CI) is reported. AUC of 0.8 or above indicates a high level of predictive power, while an AUC of 0.6 or less indicates poor level of predictive power.
