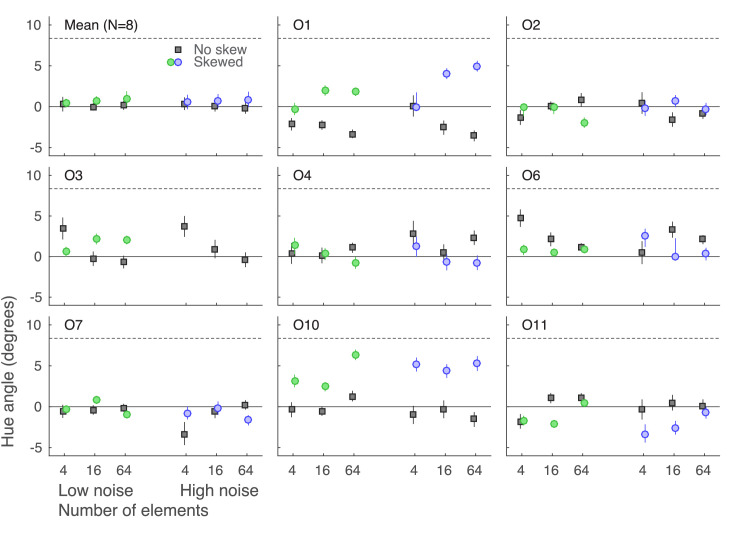
Figure 7.
Perceptual biases in Experiment 3. The top left panel shows data averaged over eight observers, while the other panels show individual observer data. X-axes indicate different set size and noise conditions and y-axes indicate bias (point of subjective equality minus the standard stimulus mean, measured in degrees of hue angle). The solid line at the zero mark on the y-axis indicates the distribution mean and the dashed line the mode for the low-noise condition (high-noise mode is located at 13.54 on the y-axis, out of graph range). Gray squares indicate the baseline biases (with no skew) while green and blue dots indicate biases with skewed low and high noise, respectively. Error bars show ±1 SEM. Note that although different observers were assigned with either a positively or a negatively skewed noise distribution, the results are flipped to always have the distribution mode in the positive direction.

