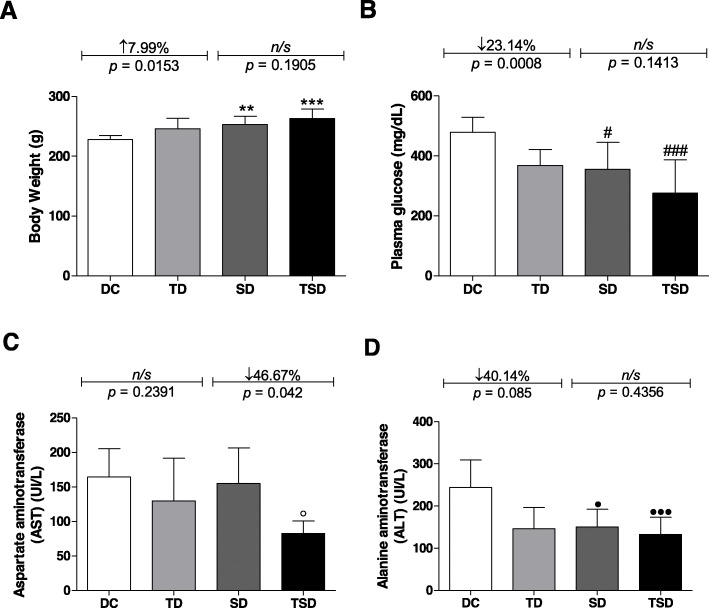
Fig. 1.
Analysis of body weight, fasting plasma glucose, aspartate aminotransferase, and alanine aminotransferase of the diabetic animals group (DC) (white bar); trained diabetics (TD) group submitted to resistance training for four weeks (light gray bar); supplemented diabetics (SD) group receiving 200 mg/kg body three times per week for four weeks (dark gray bar); and trained and supplemented diabetics (TSD) group submitted to Curcuma longa supplementation and the resistance training program simultaneously (black bar). Body weight (a), fasting plasma glucose (b), aspartate aminotransferase (AST) (c) and alanine aminotransferase (ALT) (d). Data represent the mean ± standard deviation of the mean. One-way analysis of variance (ANOVA one way) and post hoc de Bonferroni tests were used. Letters on the bars represent the significant difference by one-way ANOVA followed by Bonferroni’s test among the groups as follows: body weight (**p ≤ 0.01 for DC vs. SD; ***p ≤ 0.001 for DC vs. TSD), glucose (#p ≤ 0.05 for DC vs. SD; ###p ≤ 0.001 for DC vs. TSD), AST (p ≤ 0.05 for DC vs. TSD), and ALT (●p ≤ 0.05 for DC vs. SD; ●●●p ≤ 0.001 for DC vs. TSD). For the DC vs. TD and SD vs. TSD groups, Student’s t-test was used. ns = no significant difference. n = 7–8 in all experimental groups

