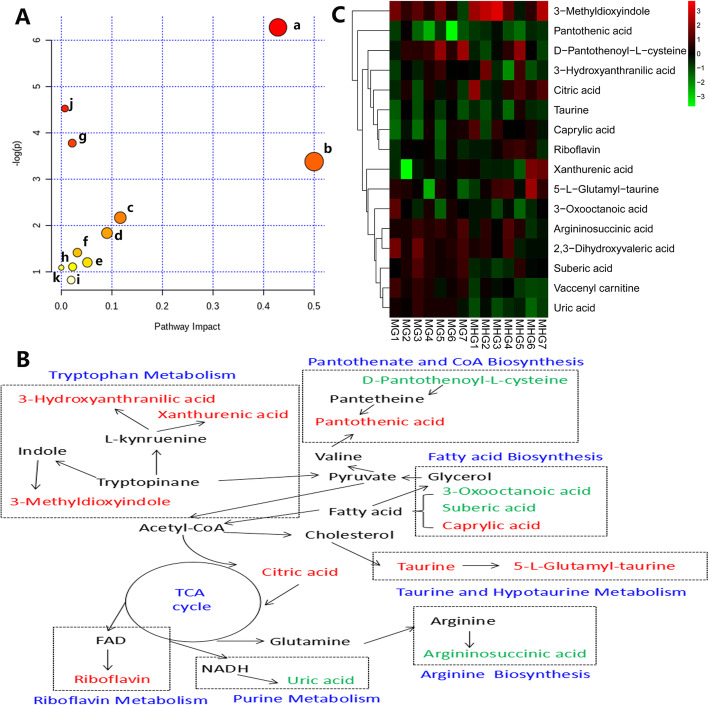
Fig. 8.
Correlation networks of potential biomarkers and heatmap of metabolites responding to MCS. a Metabolic pathway enrichment analysis (from a to k are Taurine and hypotaurine metabolism, Pantothenate and CoA biosynthesis, Alanine, aspartate and glutamate metabolism, Riboflavin metabolism, Arginine biosynthesis, Citrate cycle (TCA cycle), Glyoxylate and dicarboxylate metabolism, Tryptophan metabolism, Primary bile acid biosynthesis, Fatty acid biosynthesis and Purine metabolism), b Metabolic pathway networks analysis (the red color indicates up-regulated level; the green color indicates down-regulated level), c Heatmap of metabolites

