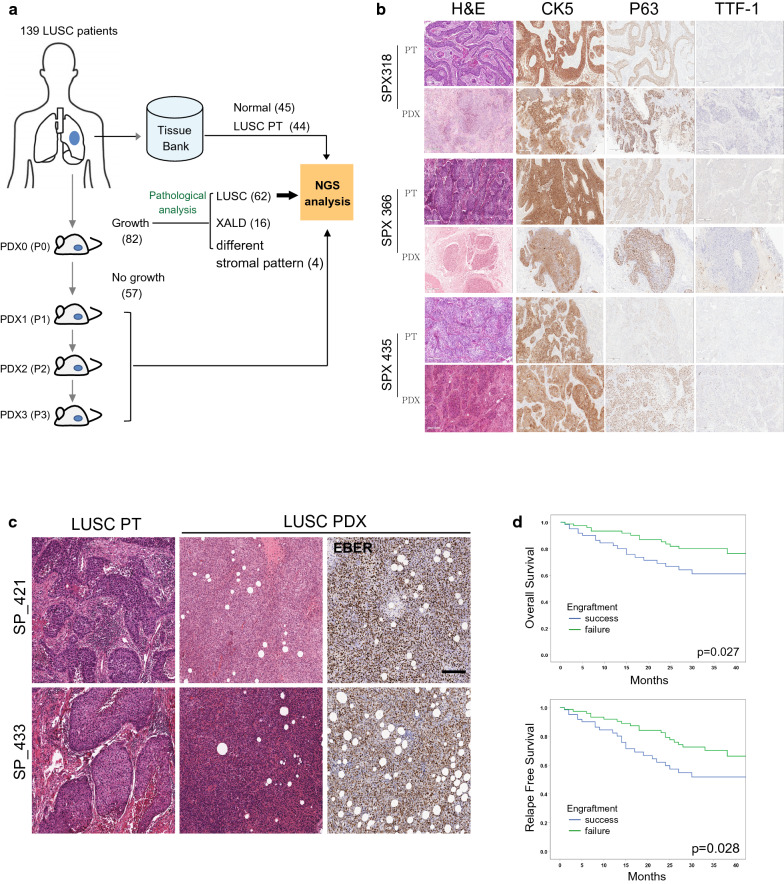
Fig. 1.
Establishment of PDX models from tumor samples from Korean patients with LUSC. a A schematic diagram of the experimental procedure for LUSC PDX models and the subsequent NGS analysis. b Representative histological and IHC-stained images of tumor samples from patients with LUSC and PDX models. Scale bars, 200 μm. c Representative histological images showing the tumor samples from the patients with LUSC and PDX models. Epstein–Barr virus (EBV)-encoded RNA (EBER) in situ hybridization images from PDX tumor samples. Brown indicates Epstein–Barr virus positive. Scale bars, 200 μm. d Kaplan–Meier plot showing overall survival (OS) or relapse-free survival (RFS) of the patients whose tumor engraftment was either successful or unsuccessful

