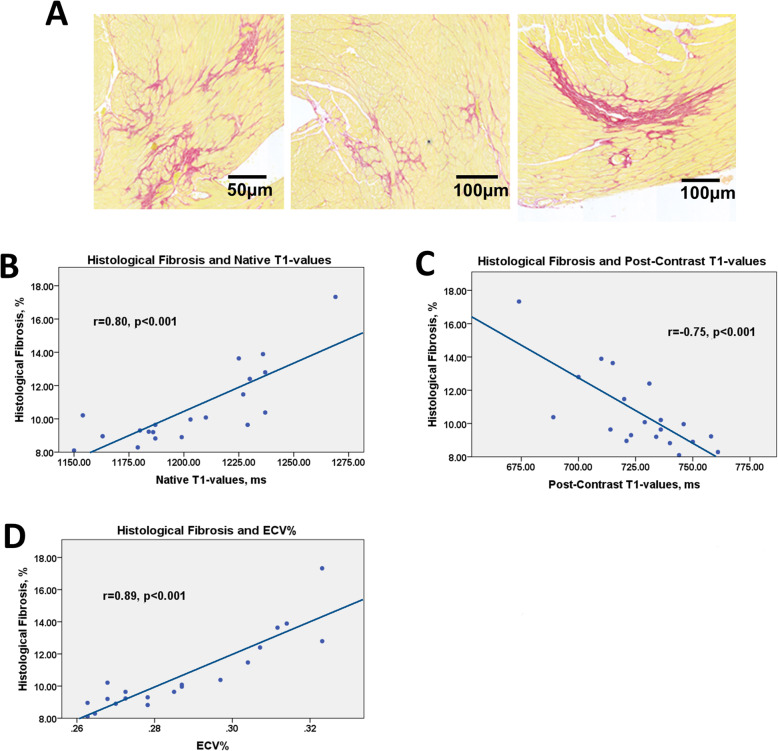
Fig. 2.
Fibrosis on histology and T1-mapping data. Examples of diffuse fibrosis in mice subjected to systemic hypertension for 6 weeks on histology - picrosirius red staining (A). The relationship between fibrosis on histology and the native T1-values (B), post contrast T1-values (C) and the extracellular volume (D). While native T1 and ECV showed a positive correlation with histological fibrosis due to kinetics of the contrast agent’s myocardial clearance, post-contrast T1 values are negatively correlated with histological fibrosis. Hearts from 20 hypertensive animals sacrificed immediately after imaging (during the infusion of angiotensin II at the 2-week (n = 5), 4-week (n = 3) and 6-week (n = 12) timepoint) were used for this analysis. Pearson’s correlation coefficient

