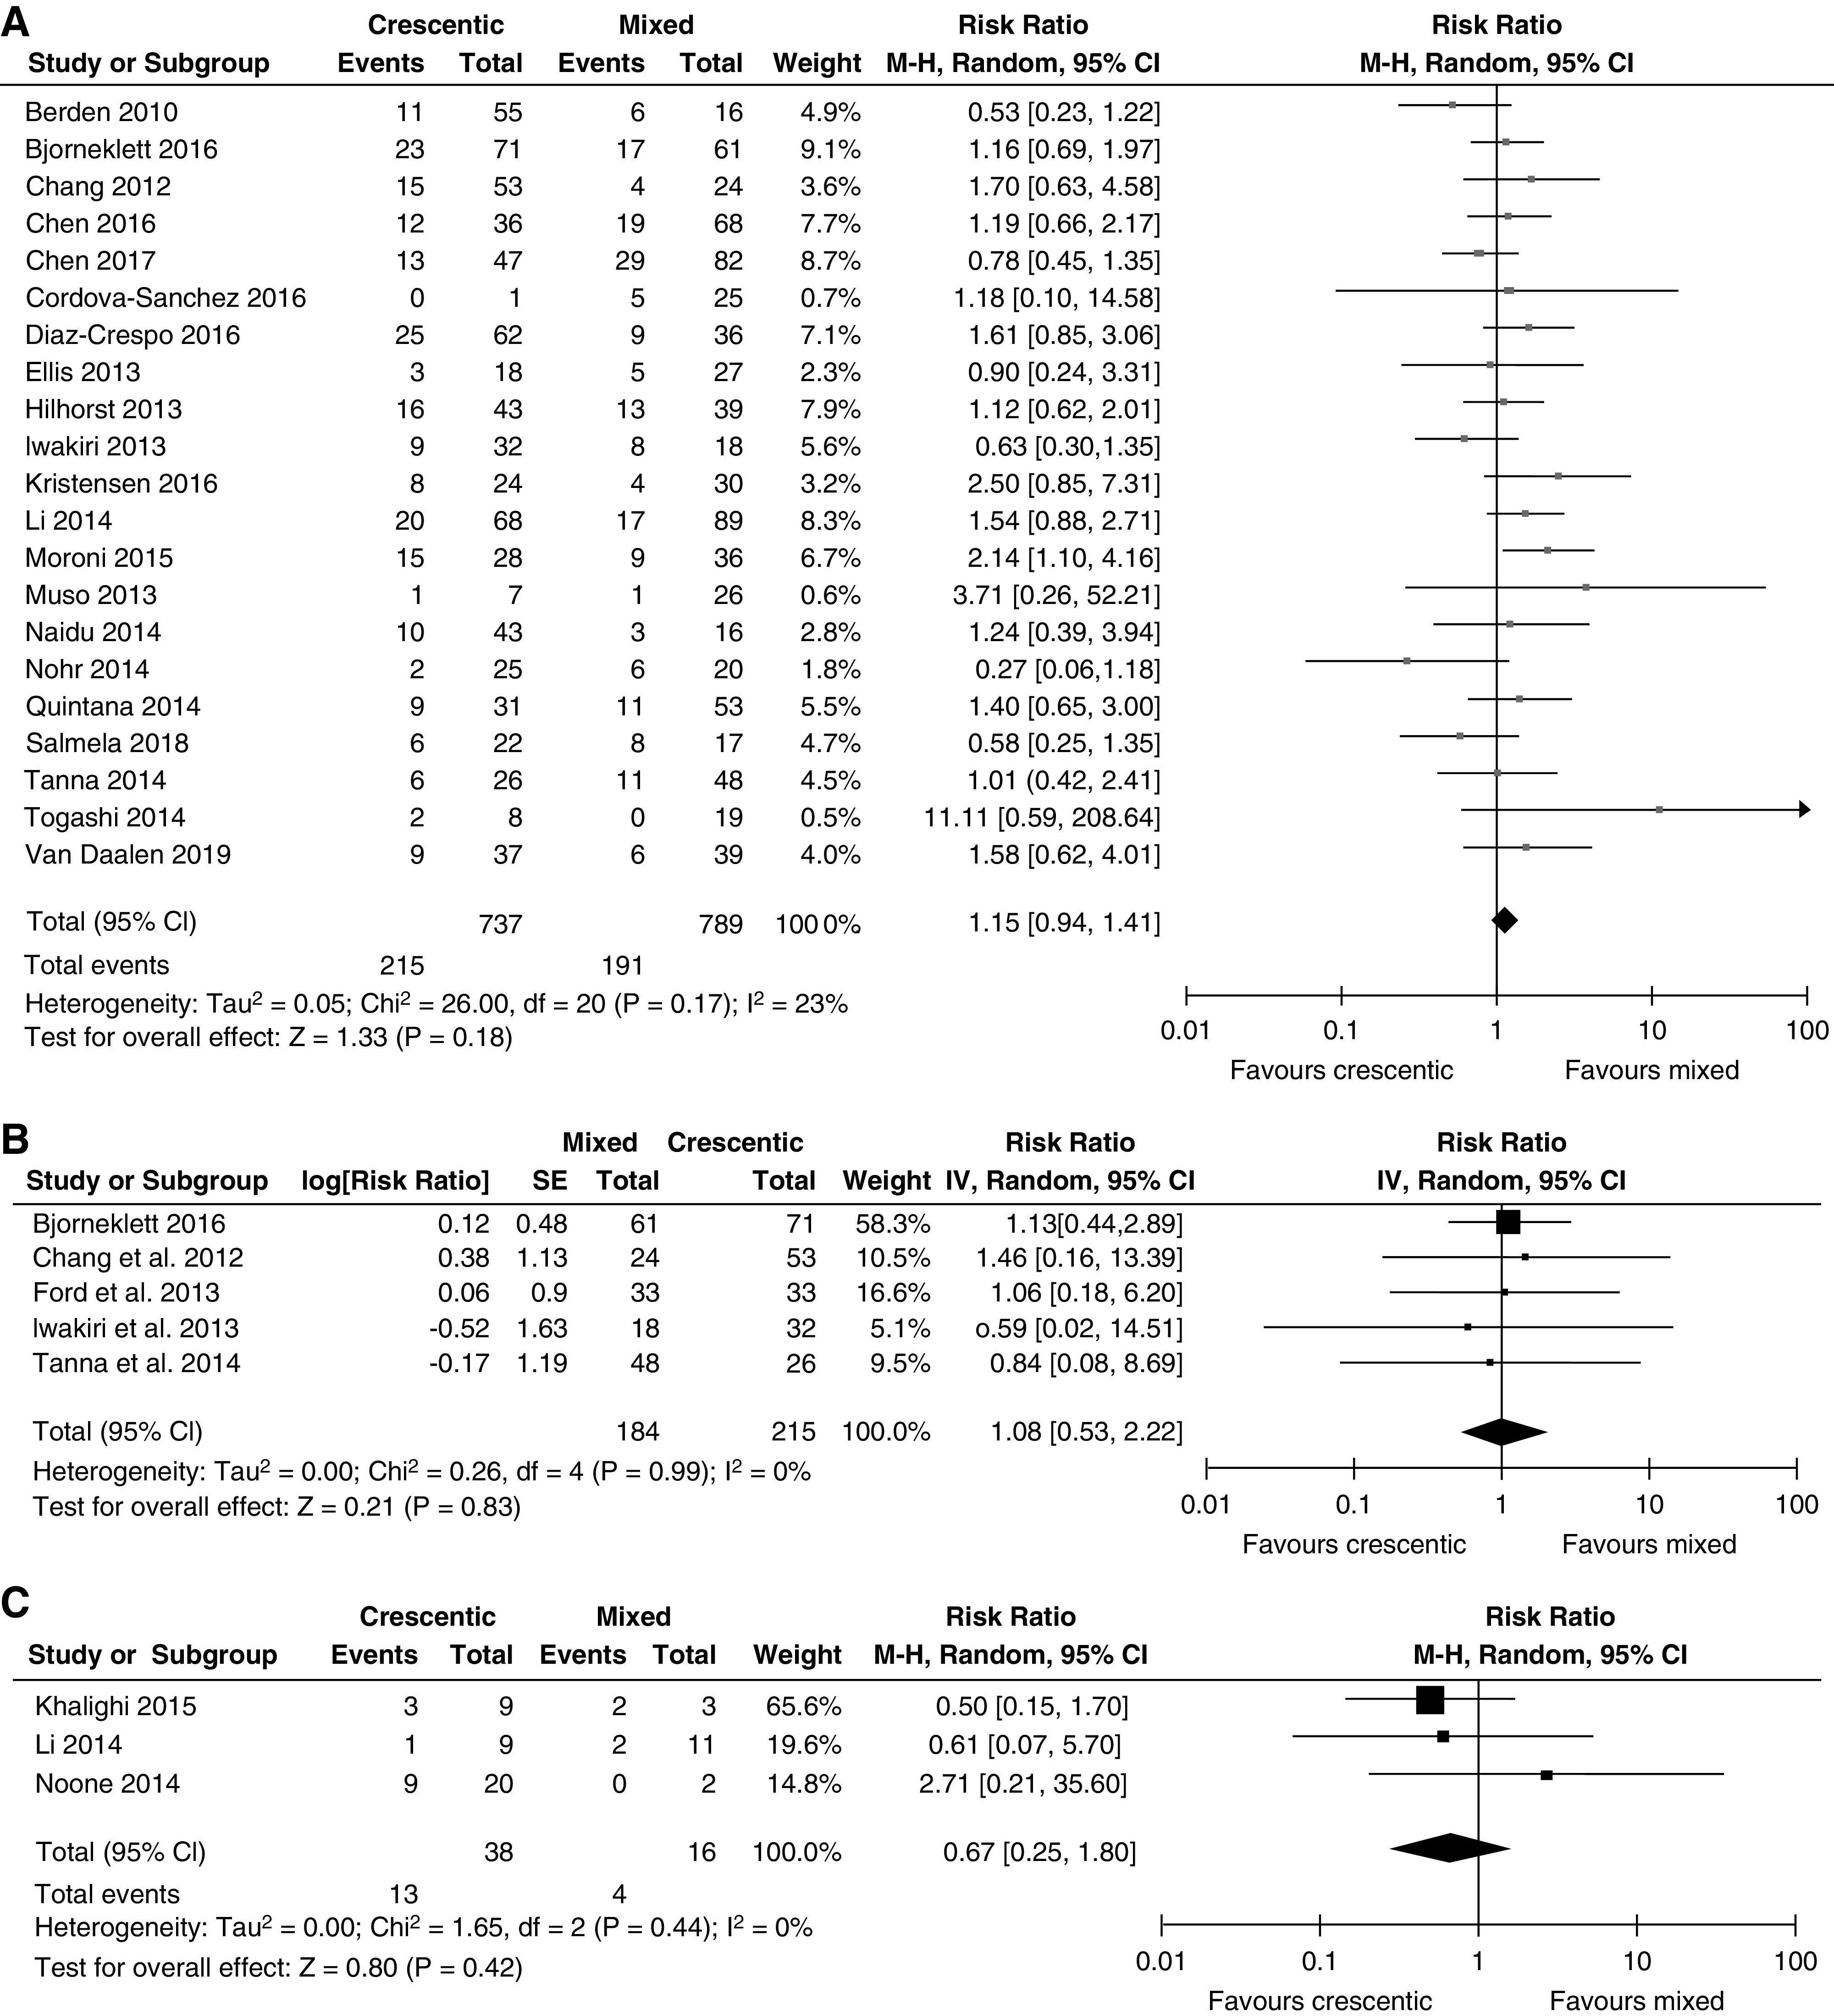
Figure 2.

Forest plots of risk ratios showing no significantly differences between crescentic and mixed classes in the meta-analyses. (A) Using kidney failure-event rates in adult patients. (B) Using adjusted hazard ratios in adult patients. (C) Using kidney failure-event rates in pediatric patients. 95% CI, 95% confidence interval; IV, inverse variance; M-H, Mantel-Haenszel; SE, SEM.
