
Figure 2: General characteristics of candidate reference gene sample Cq distributions.
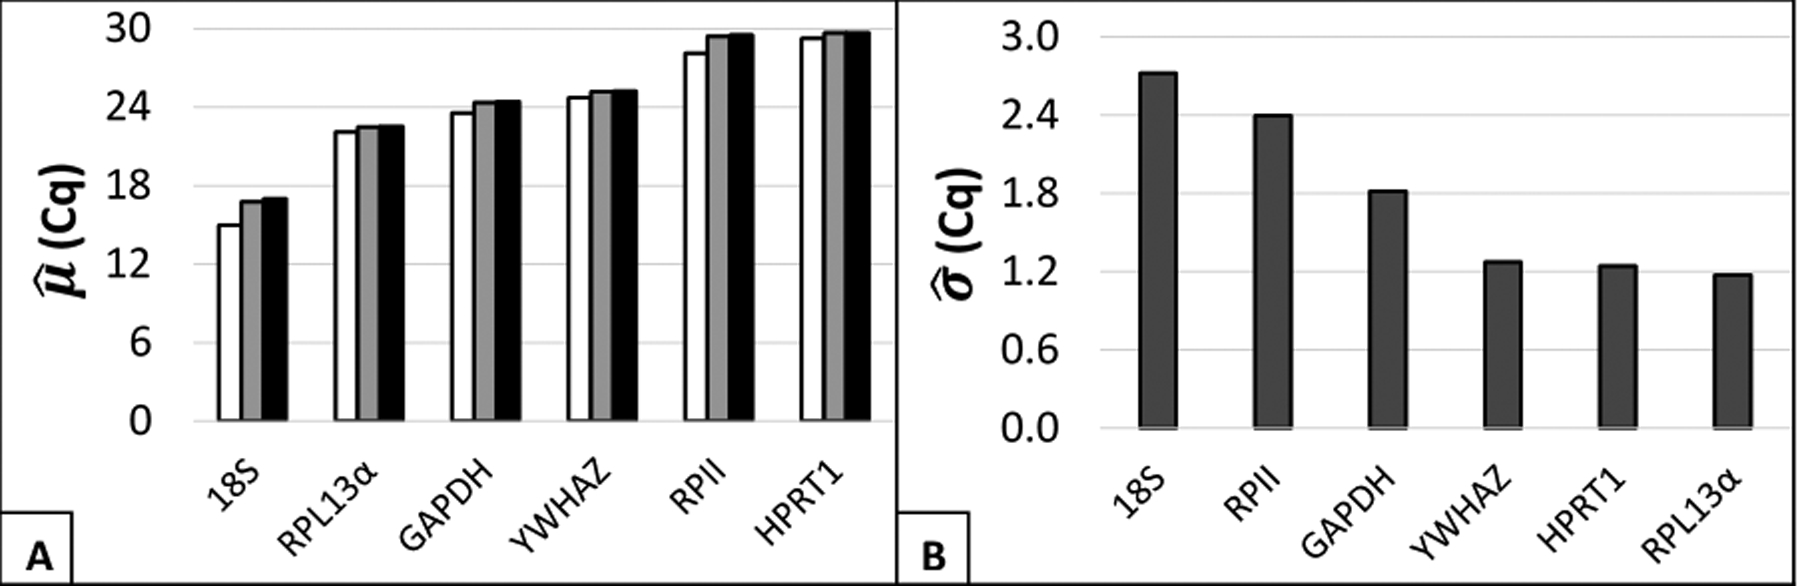
(A) Respective estimates of mean Cq () were calculated for sample Cq values using [white] relative transcript quantities, [grey] geometric averaging, and [black] arithmetic averaging. (B) Respective estimates of standard deviation () were calculated from sample Cq values.