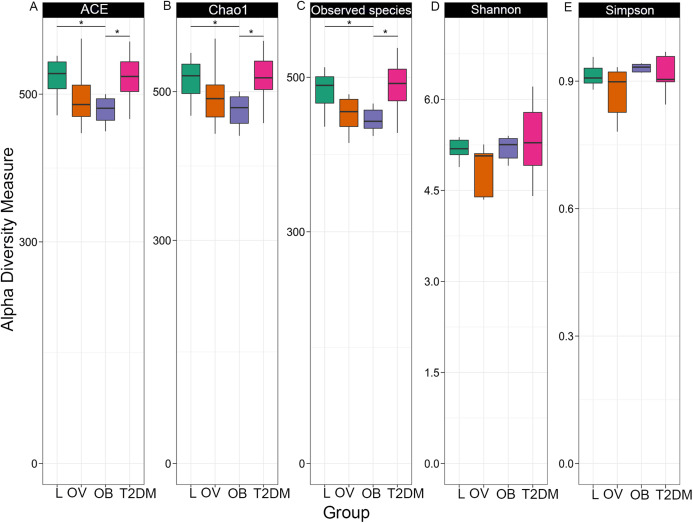
Figure 2. Boxplots of alpha diversity indices in each group (L, OV, OB and T2DM).
Alpha diversity measured by (A) ACE index, (B) Chao1 index, (C) observed species, (D) Shannon index, and (E) Simpson index. The paired comparisons were determined using Wilcoxon rank–sum test adjusted for multiple testing with the Benjamini–Hochberg method (asterisks indicate q < 0.05).

