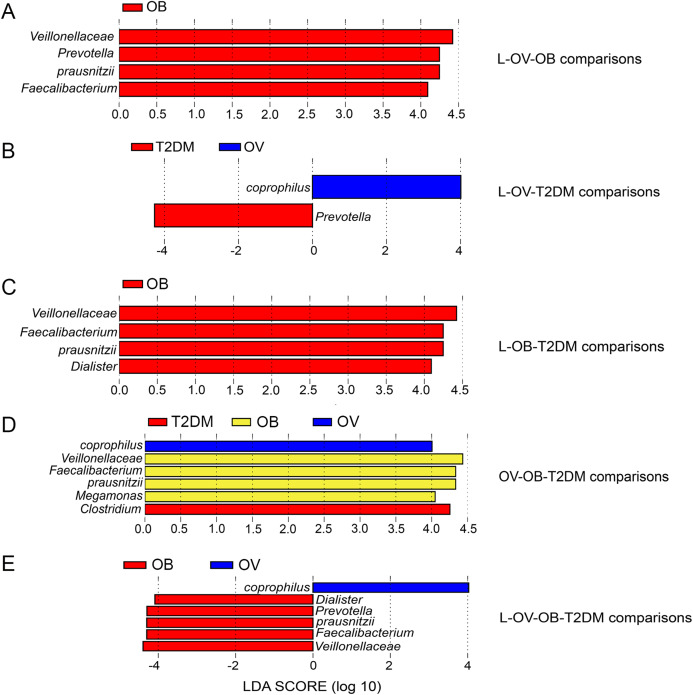
Figure 4. LEfSe analysis of fecal microbiota in BMI groups and T2DM group.
(A) LEfSe comparing microbiome between L, OV, and OB groups. (B) LEfSe comparing microbiome between L, OV, and T2DM groups. (C) LEfSe comparing microbiome between L, OB, and T2DM groups. (D) LEfSe comparing microbiome between OV, OB, and T2DM groups. (E) LEfSe comparing microbiome between L, OV, OB, and T2DM groups. Histogram of LDA scores showing taxa with significant differences among groups (LEfSe bar at species level, p < 0.05, LDA value > 4). Species whose LDA scores (the effect size) are larger than 4 were presented as bars in different colors (blue, red, and yellow).

