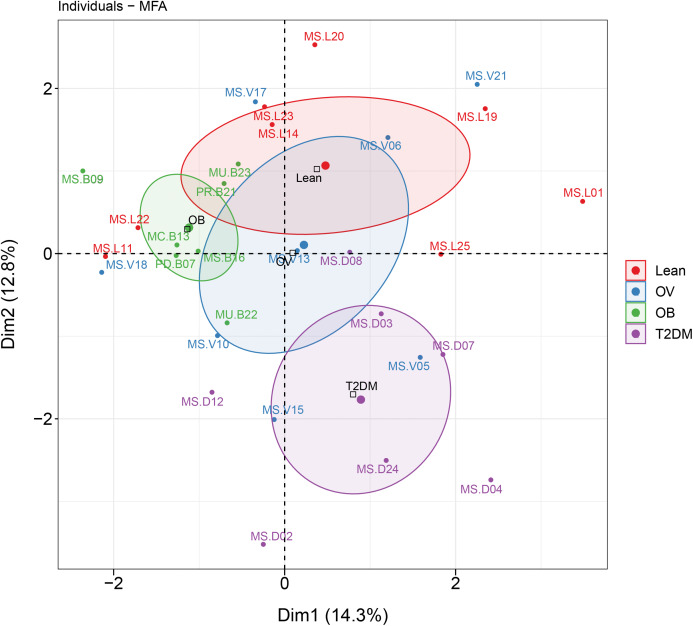
Figure 6. MFA analysis of dietary consumption, blood profiles, and fecal gut microbiota of subjects in different BMI groups and T2DM group.
The factor map presents the integration of dietary consumption, blood profiles (HDL cholesterol and fasting glucose level), and fecal gut microbiota (at genus level) of subjects in different BMI groups and T2DM group based on the MFA. The coordinates of the individuals are indicated by the 95% confidence ellipses including orange (L), blue (OV), green (OB), and purple (T2DM).

