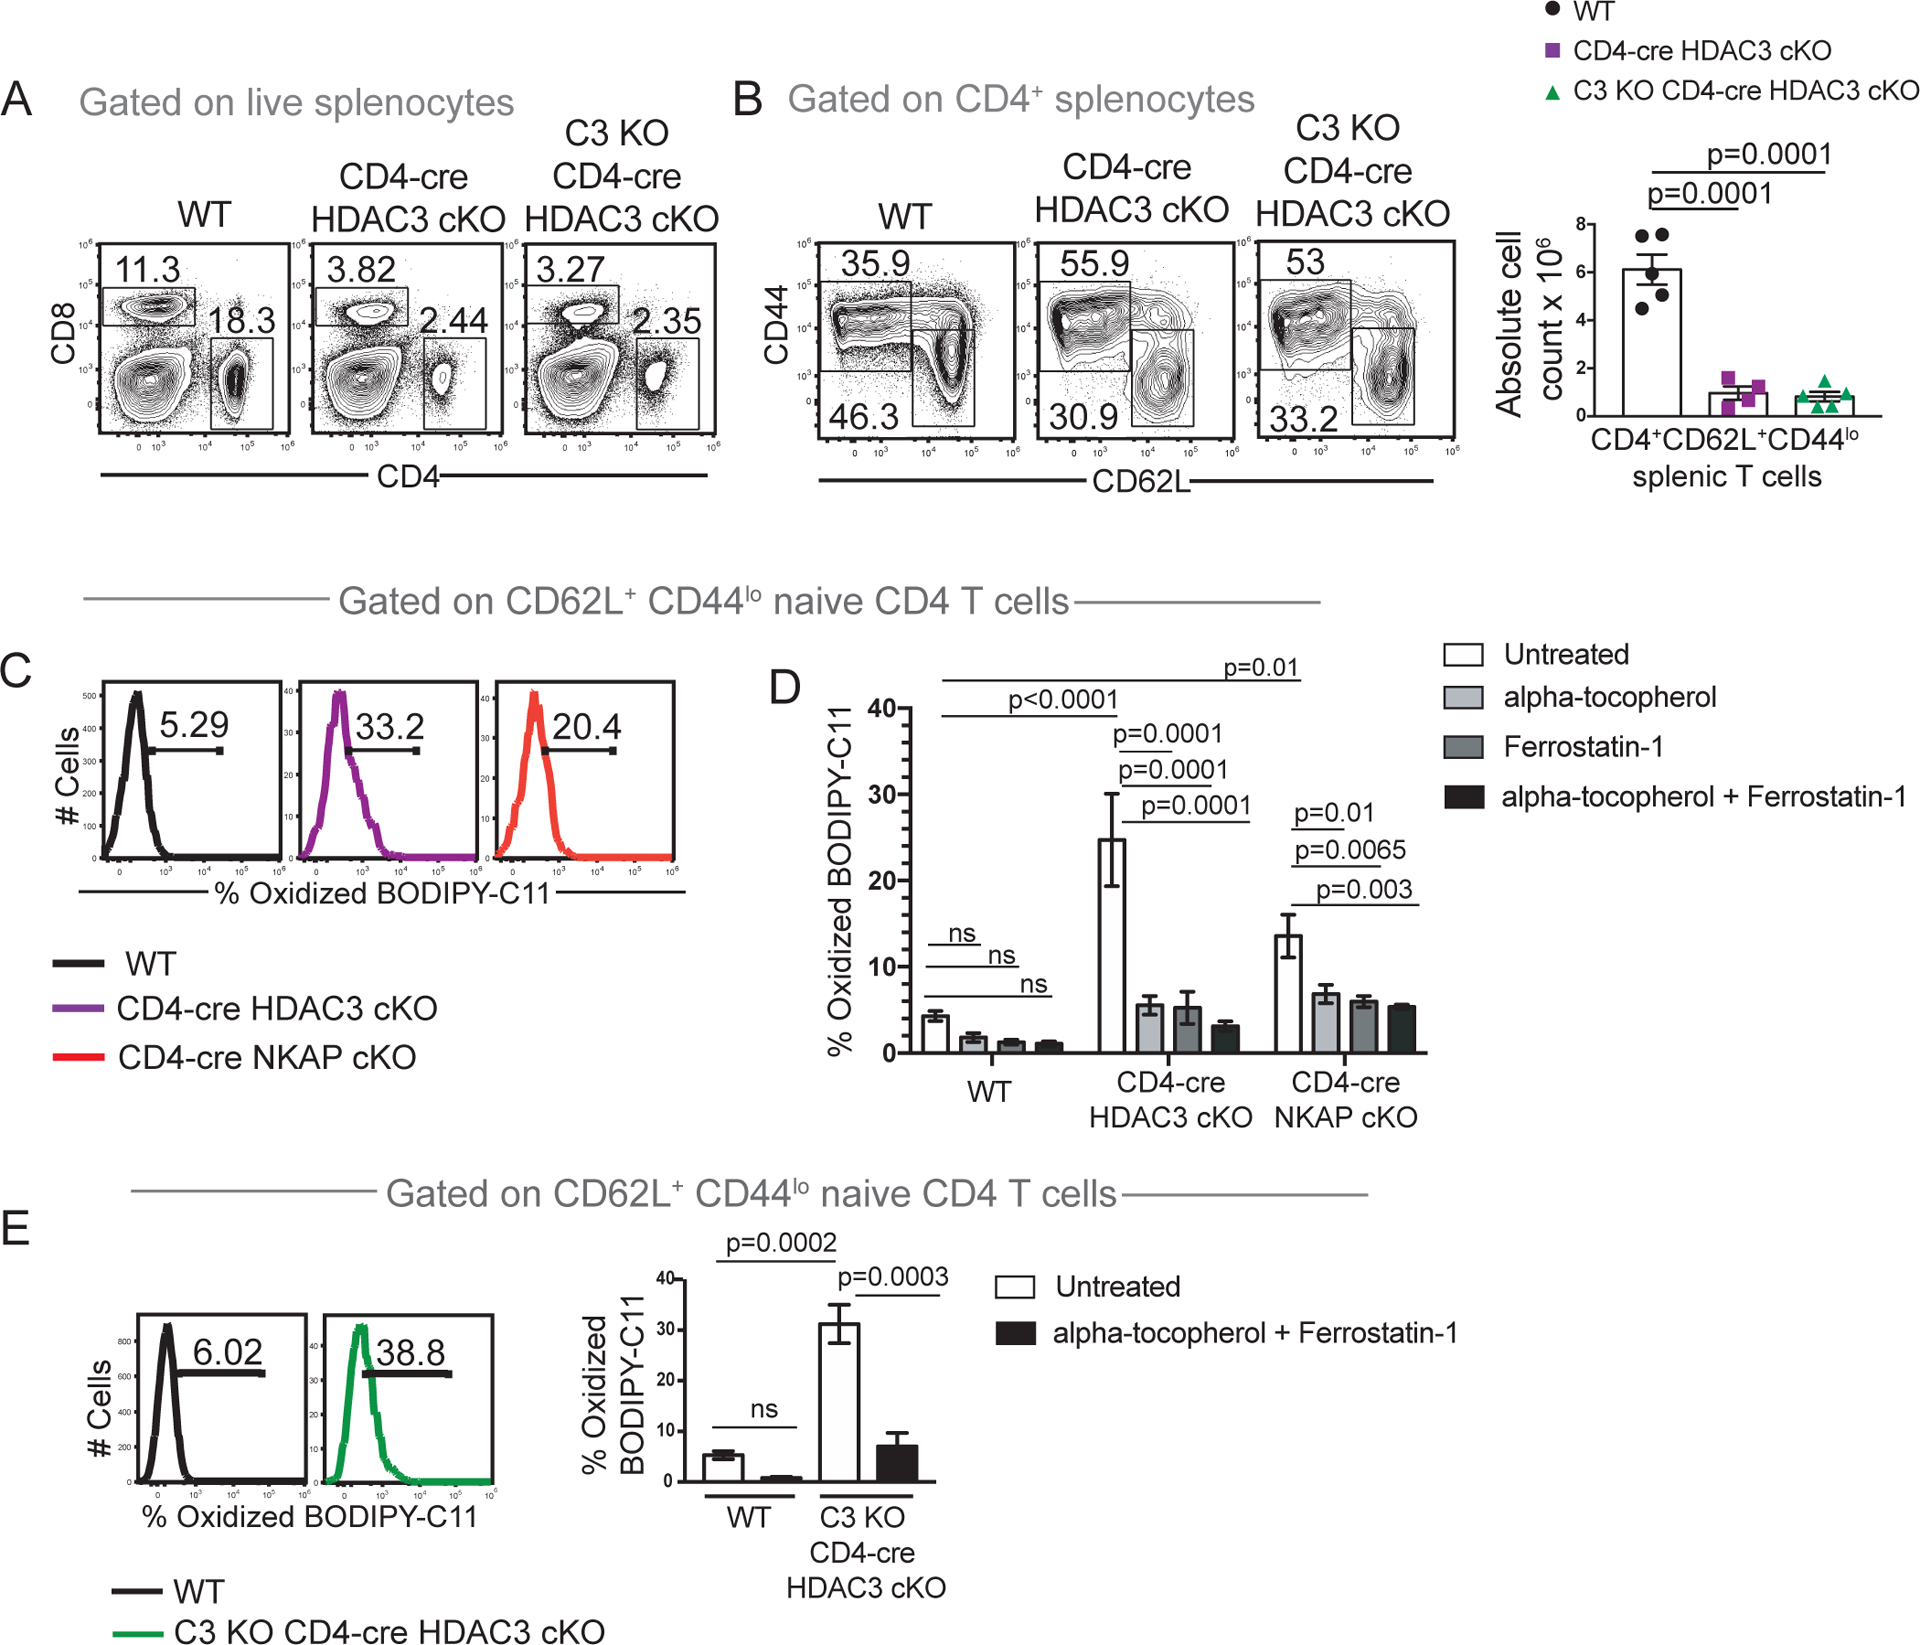
Figure 6. HDAC3 and NKAP are required to prevent lipid peroxidation, a hallmark feature of ferroptosis.

(A) Examination of frequencies of total CD4 and total CD8 T cells in WT, CD4-cre HDAC3 cKO and C3 KO CD4-cre HDAC3 cKO mice. (B) Examination of frequency and absolute cell numbers of naïve CD4 T cells in WT, CD4-cre HDAC3 cKO and C3 KO CD4-cre HDAC3 cKO mice. (C) Assessment of frequency of WT, CD4-cre HDAC3 cKO and CD4-cre NKAP cKO naïve CD4 T cells T cells undergoing lipid peroxidation using BODIPY-C11 581/591 which fluoresces in the FITC channel upon oxidation (oxidized BODIPY-C11). Cells were analyzed after incubation with BODIPY-C11 581/591 for 1 hour in culture. (D) Comparison of frequencies of WT, CD4-cre HDAC3 cKO and CD4-cre NKAP cKO naïve CD4 splenocytes positive) after 15-minute treatments with alpha-tocopherol (vitamin E), Ferrostatin-1 or a combination of both followed by incubation with BODIPY-C11 581/591 for 1 hour in culture. Bar graphs are mean frequency of BODIPY-C11+ naïve T cells from 4 independent experiments with at least one mouse per genotype per experiment. Error bars indicate SEM. p-values were calculated using two-way ANOVA with multiple comparisons. (E) Assessment of frequency of naïve CD4 T cells undergoing lipid peroxidation in WT and C3 KO CD4-cre HDAC3 cKO mice using BODIPY-C11 581/591. Assessment of mean frequency of oxidized BODIPY-C11 cells in WT, CD4-cre HDAC3 cKO and C3 KO CD4-cre HDAC3 cKO mice after treatment with alpha-tocopherol (vitamin E) and Ferrostatin-1 in combination. Bar graphs are mean frequency of BODIPY-C11+ naïve T cells from 3 independent experiments with one mouse per genotype per experiment. Error bars indicate SEM. All p-values were calculated using two-way ANOVA with multiple comparisons within genotypes (untreated versus treatment with each inhibitor or inhibitors in combination) and across genotypes (WT versus CD4-cre HDAC3 cKO or CD4-cre NKAP cKO or C3 KO CD4-cre HDAC3 cKO).
