Abstract
Stimulation of G protein-coupled receptors (GPCR) by hormones and neurotransmitters elicits cellular responses, many of which result from alterations in the concentrations of cytosolic cAMP and Ca2+. Here, we describe a microplate reader fluorescence resonance energy transfer (FRET) assay that uses the genetically encoded biosensors H188 and YC3.60 so that it is possible to monitor the kinetics with which alterations of [cAMP] or [Ca2+] occur in monolayers or suspensions of living cells exposed to GPCR agonists. This protocol uses HEK293 cell lines doubly transfected with a FRET biosensor and a recombinant GPCR of interest (e.g., glucagon receptors, CCK2 receptors, or NPY2R receptors). The protocol allows for rapid screening of small molecule GPCR agonists and antagonists, and it is also useful for discovery of synthetic mono-, dual-, and tri- agonist peptides with GPCR activating properties.
Keywords: FRET, cAMP, Ca2+, GPCR, High-throughput screening
Background
Live-cell fluorescence resonance energy transfer (FRET) assays in combination with microscopy and digital imaging technologies are commonly used to monitor the kinetics with which levels of cAMP and Ca2+ fluctuate in response to GPCR agonist stimulation. Here, we report an alternative approach that does not use microscopy but that instead enables FRET-based detection of cAMP and Ca2+ in a 96-well format using an automated microspectrofluorimeter and monolayers or suspensions of living cells. The protocol uses genetically encoded biosensors so that averaged kinetic data for pharmacological studies can be obtained in real time using a microplate reader under conditions in which GPCR agonists are applied at known concentrations. These FRET assays use cell lines stably expressing the cAMP biosensor H188 ( Klarenbeek et al., 2015 ) or the Ca2+ biosensor YC3.60 ( Nagai et al., 2004 ), both of which exhibit superior dynamic range in comparison to earlier FRET reporters. Our protocol describes how H188 or YC3.60 can be expressed stably with recombinant GPCRs so that precise dose-response analysis is achievable. This protocol builds on our published studies, whereby novel dual agonist and triagonist properties of synthetic GPCR agonist peptides (e.g., EP45 and GGP817) were discovered ( Chepurny et al., 2018 and 2019).
Using the genetically encoded biosensor Epac1-camps ( Nikolaev et al., 2004 ), we were the first to develop a 96-well microplate FRET assay in which fluctuations of [cAMP] were monitored in monolayers of living cells in real time using a microspectrofluorimeter (FlexStation 3, Molecular Devices) ( Chepurny et al., 2009 ). More recently, we have optimized this approach for purposes of drug discovery in a high-throughput mode. The major technical advance concerns our use of H188 and YC3.60, both of which we find to be highly responsive to cAMP and Ca2+, respectively. Importantly, our plate reader FRET assays using H188 or YC3.60 require their high-level expression, either by stable transfection to generate clonal cell lines ( Chepurny et al., 2018 ), or by adenoviral transduction of cell lines ( Chepurny et al., 2018 and 2019). Transient transfection is not useful since low-level expression of these biosensors is not compatible with the limited light detection limits of available microplate readers.
For the H188 reporter expressed in our clonal C24 HEK293 cell line, the cAMP-elevating agent forskolin induces a maximal 100% increase of the 485/535 ΔFRET ratio, a response that greatly exceeds the 12% value typically observed using Epac1-camps ( Chepurny et al., 2009 and 2018). This C24 clone exhibits high sensitivity (EC50 500 nM) and excellent Z-score (0.77) when testing forskolin ( Chepurny et al., 2018 ). Calibration of the FRET signal is obtained in assays that use digitonin-permeabilized C24 cells expressing H188 and that are bathed in known concentrations of cAMP ( Chepurny et al., 2018 ). When administering forskolin by its bolus injection into individual wells of a microplate containing monolayers of C24 cells, the time course of adenylyl cyclase activation and resultant cAMP production is monitored with high precision within the first 30 s.
We have also created doubly-transfected HEK293 cells lines that stably express H188 or YC3.60 along with recombinant GPCRs of interest. These GPCRs include glucagon, glucagon-like peptide-1 (GLP-1), glucose-dependent insulinotropic peptide (GIP), peptide YY (PYY), corticotropin releasing hormone (CRH), and cholecystokinin (CCK) receptors. It is also possible to perform such FRET assays using HEK293 cells that stably express H188 or YC3.60, but are instead transiently transfected with a GPCR. Conversely it is possible to use a cell line that stably expresses a recombinant GPCR so that cells may then be virally transduced with H188 or YC3.60.
Our real-time kinetic assay using H188 and living cells differs from single-endpoint HTR-FRET assays that monitor levels of cAMP in cell lysates. For example, the LANCE® cAMP assay (Perkin Elmer) uses a Europium-labeled cAMP tracer (FRET donor) in combination with a fluorophore-tagged anti-cAMP antibody (FRET acceptor), both of which are added to a reaction mixture so that the competition of fluorescent cAMP and non-fluorescent cAMP (i.e., endogenous cAMP) for the anti-cAMP binding site on the antibody can be measured. In contrast, H188 is unimolecular in which the cAMP-binding protein Epac1 is flanked by the FRET donor mTurquoise2 and the FRET acceptor cp173 Venus-Venus so that a decrease of FRET occurs upon binding cAMP ( Klarenbeek et al., 2015 ). YC3.60 instead uses a Ca2+-binding domain of calmodulin (CaM), and the CaM-binding peptide M13, in combination with the FRET donor ECFP11, and the FRET acceptor cp173Venus so that an increase of FRET occurs upon binding Ca2+ ( Nagai et al., 2004 ). Unlike HTR-FRET assays, H188 and YC3.60 allow live-cell real-time determinations of FRET in the kinetic mode.
Summarized below is a detailed FRET assay protocol that provides additional technical information not previously contained in the methods sections of our prior publications ( Chepurny et al., 2009 , 2018 and 2019). We also present new information concerning previously unpublished methodology that allows GPCR agonist action to be studied in cells that stably express both a recombinant GPCR and a select FRET biosensor.
Materials and Reagents
10 ml Serological Pipet (Krackeler, catalog number: 229010B)
5 ml Serological Pipet (Krackeler, catalog number: 229005B)
1.5 ml Centrifuge Tube (Axygen, catalog number: MCT-150-C)
15 ml Centrifuge Tube (Krackeler, catalog number: 229411)
50 ml Centrifuge Tube (Krackeler, catalog number: 229421)
100 mm x 20 mm Tissue Culture Dish (Krackeler, catalog number: 229621)
96-Well Plate Black, Clear Bottom (Corning, catalog number: 3603)
96-Well Plate, V-Bottom (Greiner Bio-One, catalog number: 651201)
FlexStation Pipette Tips (Black, 96) (Molecular Devices, catalog number: 9000-0911)
Finntip Flex 300 μl Sterile Pipette Tips (Thermo Scientific, catalog number: 94060513)
Channelmate 25 ml Inserts (USA Scientific, catalog number: 1346-2510)
Multiwell Plate Washer/dispenser Manifold (Sigma, catalog number: M2781-1EA)
0.2 μm PES Membrane Filter for Vacuum Filtration
HEK293/hNPY2R/H188 c18 cells expressing human NPY2R receptor and H188
HEK293/hGCGR/H188 c10 cells expressing human glucagon receptor and H188
HEK293/hCCK2R c29 cells expressing human CCK2R only
Sodium Chloride (Fisher Scientific, catalog number: BP358-1)
Sodium Hydroxide (Fisher Scientific, catalog number: BP359-500)
Potassium Chloride (Fisher Scientific, catalog number: BP366-500)
Magnesium Chloride Hexahydrate (Fisher Scientific, catalog number: BP214-500)
Calcium Chloride Dihydrate (Fisher Scientific, catalog number: BP510-100)
D-Glucose (Sigma, catalog number: G5767-500G)
HEPES 1 M Solution (Sigma, catalog number: H0887; store at 4 °C)
Bovine Serum Albumin (Sigma, catalog number: A7030-100G; store at 4 °C)
Rat Tail Collagen (Life Technologies, catalog number: A10483-01; store at 4 °C)
Glacial Acetic Acid (Thermo Scientific, catalog number: A38S-500)
Phosphate-Buffered Saline, 1x (Corning, catalog number: 21-040-CV)
DMSO (Sigma, catalog number: D8418-100ML)
Fetal Bovine Serum (Sigma, catalog number: 12303C-500ML; store at -20 °C)
Dulbecco’s Modified Eagle Medium (Sigma, catalog number: D6429-500ML; store at 4 °C)
Trypsin-EDTA (0.25%) (Thermo Scientific, catalog number: 25200072; store at -20 °C)
Pen Strep (Life Technologies, catalog number: 15140-122; store at -20 °C)
G-418 Disulfate Salt Solution (Sigma, catalog number: G8168-10ML; store at 4 °C)
Forskolin (Sigma, catalog number: F6886-10MG)
Glucagon (Sigma, catalog number: G1774-.1MG; store at -20 °C)
Demogastrin-2 (DG2) (Pichem, Bat. No. M24-061202; store at -20 °C)
PYY(3-36) (Sigma, catalog number: P220-500UG; store at -20 °C)
Standard Extracellular Saline (SES) Solution, pH 7.4 (see Recipes)
Rat Tail Collagen (RTC) Coating Solution (for one 96-well plate) (see Recipes)
Equipment
Biological Biosafety Cabinet (Labconco, model: 346001)
FP-Novus MCP8 30-300 μl 8-channel Pipette (Thermo Scientific, catalog number: 4630040)
Water Jacketed CO2 Incubator (Thermo Electron, NAPCO, model: 8000WJ)
FlexStation 3 microplate reader (Molecular Devices)
Vapro Osmometer (Vescor, model: 5520)
Bright-Line Hemacytometer (Fisher Scientific, catalog number: 02-672-5)
Software
SoftMax Pro v.5.4.6 (Molecular Devices, http://www.moleculardevices.com)
-
Origin 8 (OriginLab, www.originlab.com)
Note: If Softmax Pro 7 is used, no need for Origin 8 to analyze data.
Procedure
-
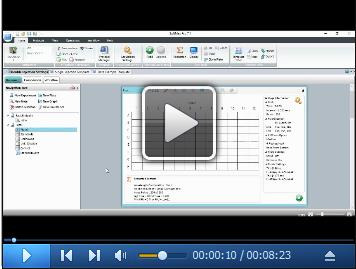
Instrument preparation: see Video 1 FlexStation 3 and SoftMax Pro 7 Preparation for details
Turn on FlexStation 3.
Set temperature to 25 °C.
Load pipette tip rack in tip rack drawer.
Open SoftMax Pro file on computer connected with FlexStation 3. Set up the protocol.
-
Preparation of the reading plate with cells in suspension
Aspirate medium from 10 cm tissue culture dish with cells at 80-90% confluent. Add 2 ml Trypsin-EDTA solution to dish and return dish to tissue culture incubator for 2 min. Neutralize Trypsin-EDTA by adding 3 ml fresh culture medium, then transfer the cells to 15 ml tube and centrifuge for 2 min at 150 x g.
Aspirate supernatant and resuspend cells in 21 ml SES for single injection experiment, or in 16 ml SES for double injection experiment. Transfer cell suspension in Channelmate 25 ml insert. Using 8-channel pipette, transfer suspension to 96-well black clear bottom reading plate, 200 μl/well for single injection experiment, or 150 μl/well for double injection experiment.
Load reading plate with cells in reading chamber drawer of the FlexStation 3.
Incubate cells 20 min in the reading chamber at 25 °C to allow equilibration prior to performing experiment.
If the protocol requires pretreatment with a GPCR antagonist, pretreat the cells with the antagonist prior to the aforementioned 20 min incubation step mentioned in line 4.
-
Preparation of the reading plate with adherent cells
Depending on the clonal cell line used, some clones show a small injection artifact upon administration of test solutions to suspensions of these cells. This artifact can be avoided by performing the experiment with a monolayer of adherent cells grown in reading plate wells coated with rat tail collagen (RTC). This approach requires an additional day since overnight culture of the cells on RTC is required.
Day 1:
-
Coating plate with Rat Tail Collagen
In the tissue culture hood transfer Rat Tail Collagen Coating Solution in Channelmate 25 ml insert. Using 8-channel pipette, transfer solution to 96-well black clear bottom reading plate, 50 μl/well.
Incubate plate for 60 min at room temperature.
Using Multiwell Plate Manifold, aspirate coating solution from the plate.
Using 8-channel pipette, wash plate once with PBS 100 μl/well.
Note: Plate may be used immediately, or air dried in a tissue culture hood and stored at 2-8 °C up to one week under sterile conditions.
-
Loading reading plate with the cells
Aspirate medium from 10 cm tissue culture dish with cells. Add 2 ml Trypsin-EDTA solution and return dish to tissue culture incubator for 2 min. Neutralize Trypsin-EDTA by adding 3 ml fresh culture medium. Transfer the cells to 15 ml tube, vortex and count the cells using hemacytometer.
Centrifuge cells for 2 min at 150 × g.
Aspirate supernatant and resuspend cells in fresh culture medium to concentration 600,000 cells/ml.
-
Transfer 12 ml of the cell suspension in Channelmate 25 ml insert. Using 8-channel pipette, transfer cells to rat tail collagen-coated 96-well reading plate, 100 μl/well.
Note: A cell count of 60,000 cells/well on the plate will allow ~80-90% cell confluency the next morning after adherence of cells. Such confluency helps minimize dislodging of the cell monolayer during medium or buffer exchange during experimental preparations. If cells other than HEK293 cells are used, the cell count must be adjusted in order to reach 80-90% confluency on the day of experiment.
Incubate plate with the cells in tissue culture incubator overnight.
Day 2:
Using Multiwell Plate Manifold, aspirate culture medium from plate. Using 8-channel pipette, add SES to plate, 200 μl/well for single injection experiment, or 150 μl/well for double injection experiment.
Load reading plate with cells in reading chamber drawer of the FlexStation 3.
Incubate cells 20 min in the reading chamber at 25 °C to allow equilibration.
Prepare loading compound plate with test solutions as described in Procedure D.
Proceed with FRET assay as described in Procedure E.
-
-
Loading compound plate with test solutions
Dissolve test solutions in SES at needed concentrations. Test solution concentration must be five times higher (5x) than final desired concentration after injection of the test compound in the well containing cells.
Transfer test solutions to 96-well compound plate, 300 μl/well, to wells specified in experimental setting.
Load compound plate in compound plate drawer of the FlexStation 3.
-
Initiate FRET assay measurements
In the SoftMax Pro file containing the desired experimental protocol, click on the “Read” icon to start the FRET measurements for individual wells of the plate containing the cells.
Do not interrupt the assay while the Flexstation 3 is performing the measurements.
See Video 2 Data Analysis for details on data workup procedures within SoftMax Pro 7.
-
Representative examples of data
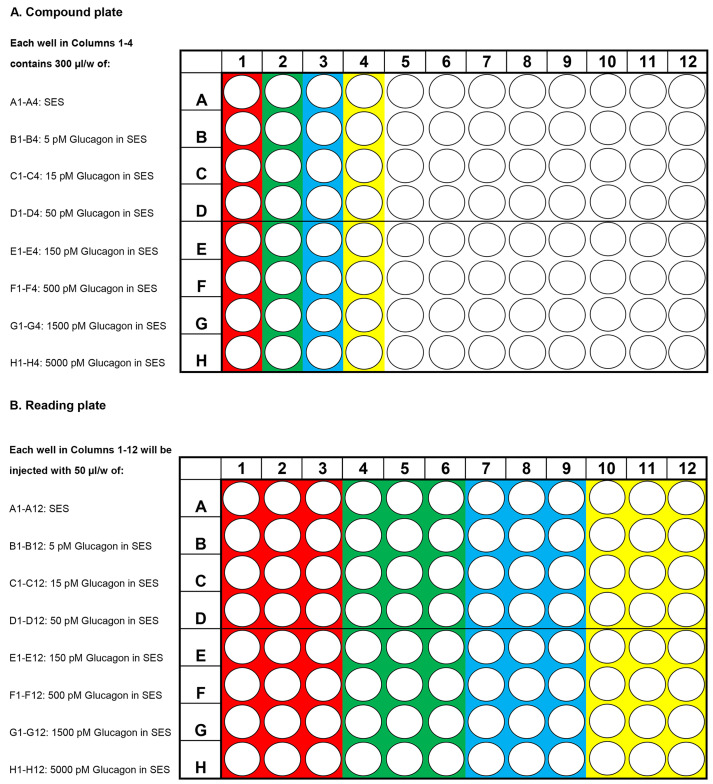
Presented in Figures 1A and 1B are examples of how to perform a FRET assay using a Flexstation 3 in 237 which H188 is used to determine the dose-response relationship for stimulatory effects of glucagon 238 on intracellular [cAMP]. Figure 1A illustrates how to load the compound plate with test solutions that 239 are dissolved in SES at a 5x higher concentration than what will eventually be the final concentration 240 after delivery of the test solutions to the reading plate. Figure 1B illustrates which wells these test 241 solutions are injected into on the reading plate that contain cells (see legend for Figure 1).
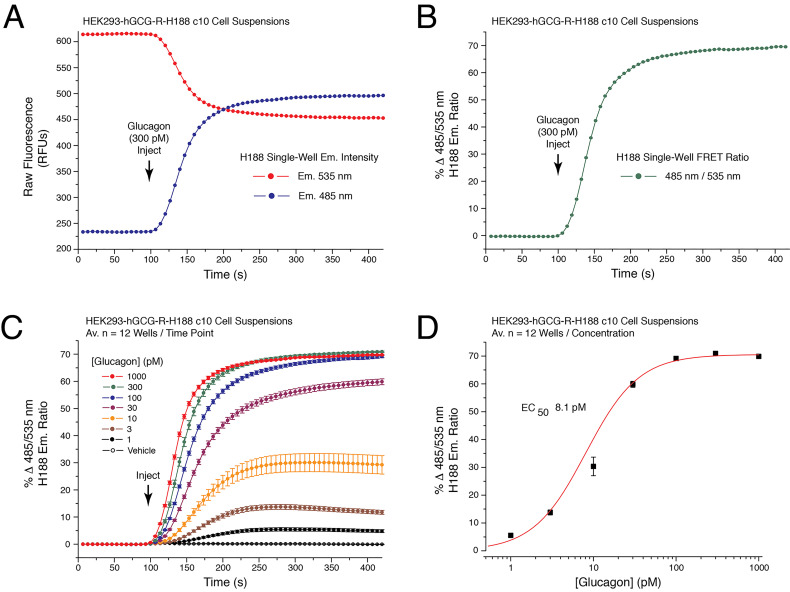
Illustrated are data obtained in these FRET assays that determine the glucagon dose-response 266 relationship (see legend for Figure 2).
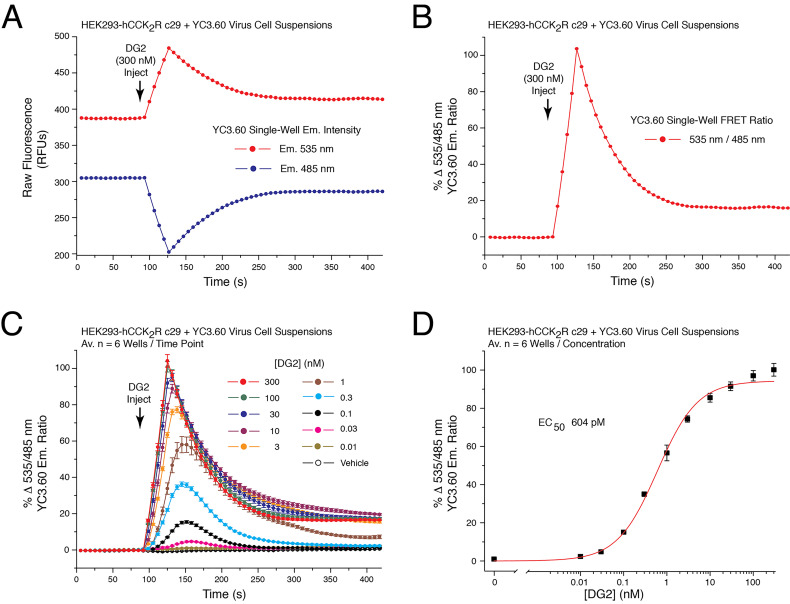
Illustrated are data obtained in FRET assays that monitor [Ca2+ 283 ]i using the YC3.60 reporter, the 284 CCK2R agonist DG2, and cells that express the CCK2R (see legend for Figure 3).
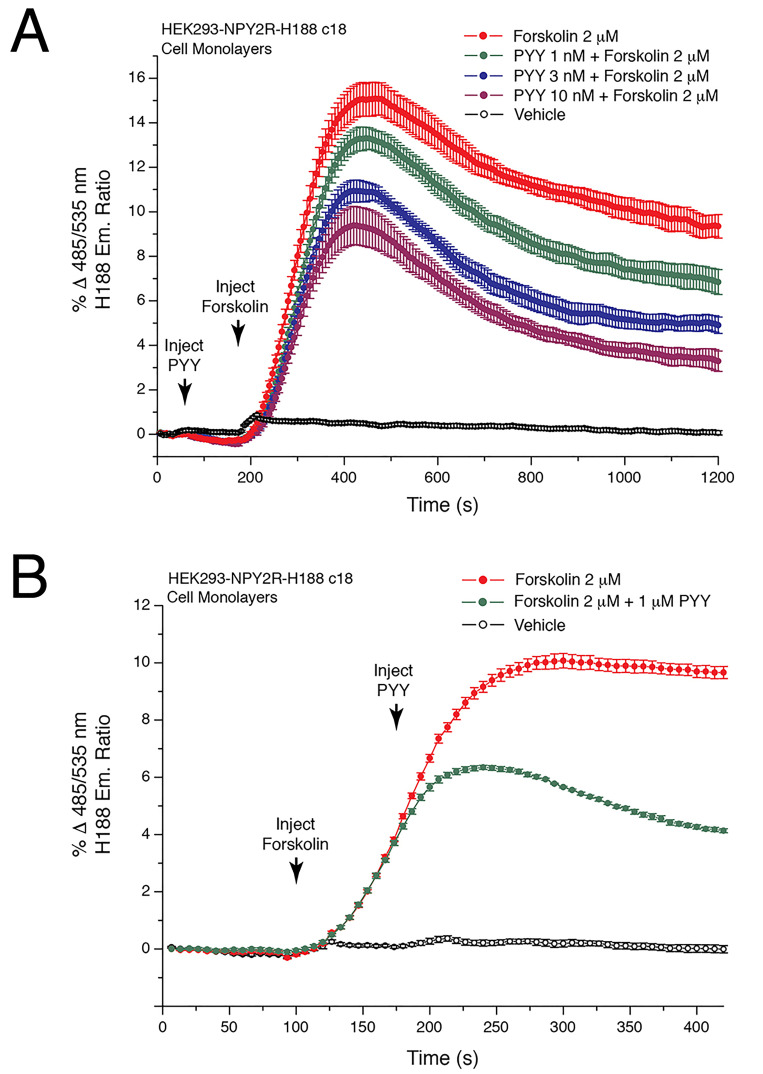
Illustrated is a double injection protocol that monitors the ability of PYY(3-36) to lower levels of 299 [cAMP] in cells that are treated with forskolin and that express NPY2R (see legend for Figure 4).
Video 1. FlexStation 3 and SoftMax Pro 7 Preparation.
Video 2. Data Analysis.
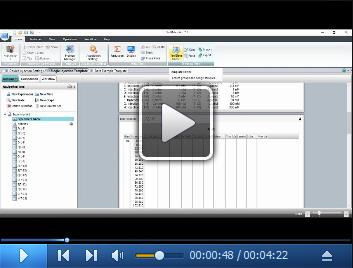
Figure 1. Design of compound and reading plates for determination of the glucagon dose-response relationship using the human glucagon receptor and cAMP sensor H188.
A. Compound plate containing test solutions. Each of the first four wells in rows A-H on the compound plate contain 300 μl of the test solution specified on the left side of the plate. For example, wells A1, A2, A3 and A4 are loaded with SES serving as the Vehicle control; wells B1, B2, B3 and B4 loaded with 5 pM glucagon in SES and so on up to 5,000 pM glucagon. For each concentration, the mean % FRET ± S.D. for n = 12 wells will be determined. B. Reading plate containing HEK293-hGCG-R-H188 c10 cell suspensions. For each concentration of glucagon tested, three wells on the reading plate receive 50 μl of a 5x concentrated test solution that is transferred from one well on the compound plate, and added to the 200 μl cell suspension. For example, the wells colored red for A1, A2 and A3; B1, B2 and B3, continuing to H1, H2 and H3 on the reading plate receive test solutions A1, B1, continuing on to H1 (red color) on the compound plate. Next, wells A4, A5 and A6; B4, B5 and B, continuing on to H4, H5 and H6 (green color) on the reading plate receive test solutions A2, B2, continuing on to H2 (green color) of the compound plate. The same procedure is applied to the remaining wells (blue, yellow color).
Figure 2. Establishment of the glucagon dose-response using cAMP sensor H188.
A. Raw data obtained from a single well on the reading plate illustrates the time-dependent reciprocal increase and decrease of 485 and 535 nm H188 relative fluorescence unit (RFU) emission intensity in response to application of 300 pM glucagon to HEK293-hGCG-R-H188 c10 cell suspensions. Administration of the test substance is indicated by the vertical arrow, here and in subsequent figures. B. Determination of the single well percent change of H188 485/535 nm emission ratio (% FRET) calculated using the single well raw data illustrated in panel 2A. An increase of the 485/535 nm FRET ratio signifies an increase of [cAMP]. A value of 0 is obtained after baseline subtraction of the FRET ratio at time point 0. A value of 70 corresponds to a 70% increase of FRET ratio relative to baseline. C. Glucagon produced a time-dependent and dose-dependent increase of the 485/535 nm H188 FRET ratio. Data for each time point is the mean % FRET ± S.D. for n = 12 wells. D. Non-linear regression analysis of the data illustrated in panel 2C demonstrated that the EC50 for glucagon action in this cell line was 8.1 pM. Non-linear regression analysis was performed with Origin 8 software using the highest FRET values for each data point. Non-linear reduction can also be performed with GraphPad Prism 8. For instruction in how to obtain values for time-dependent, dose-dependent and non-linear reduction with SoftMax Pro 7.1 see Video 2.
Figure 3. Dose-dependent action of demogastrin-2 (DG2) at the human CCK2 receptor to increase [Ca2+]i as detected using YC3.60.
A. Raw data obtained from a single well on the reading plate illustrates the time-dependent reciprocal decrease and increase of 485 and 535 nm YC3.60 relative fluorescence unit (RFU) emission intensity in response to application of CCK2 receptor agonist DG2 (300 nM) to suspensions of HEK293-hCCK2R c29 cells adenovirally transduced with YC3.60. B. Determination of the single well percent change of YC3.60 535/485 nm emission ratio (% FRET) calculated using the single well raw data illustrated in panel 3A. An increase of the 535/485 nm FRET ratio signifies an increase of [Ca2+]i. C. DG2 produced a time-dependent and dose-dependent increase of the 535/485 nm YC3.60 FRET ratio. Data for each time point is the mean % FRET ± S.D. for n = 6 wells. D. Non-linear regression analysis of the data illustrated in panel 3C demonstrated that the EC50 for DG2 action in this cell line was 604 pM. Non-linear regression analysis was performed with Origin 8 software using the highest FRET values for each data point. Non-linear reduction can also be performed with GraphPad Prism 8. For instruction in how to obtain values for time-dependent, dose-dependent and non-linear reduction with SoftMax Pro 7.1 see Video 2.
Figure 4. Peptide YY(3-36) lowers levels of cAMP in HEK293-NPY2R-H188 c18 cells.
A. HEK293/hNPY2R/H188 c18 cells stably expressing the human NPY2R receptor and H188 were allowed to adhere to an RTC-coated reading plate for overnight culture. On day 2 the ability of forskolin alone to raise levels of cAMP was monitored (red trace). Note that this action of forskolin was dose-dependently reduced when the NPY2R agonist PYY(3-36) (1-10 nM) was administered 125 s prior to administration of forskolin using a "double injection protocol". PYY(3-36) binds to NPY2R to activate Gi proteins and to lower adenylyl cyclase activity, whereas forskolin directly stimulates adenylyl cyclase. Thus, this assay monitors the opposing actions of PYY(3-36) and forskolin to control levels of cAMP. Non-linear regression analysis of the data demonstrated that the IC50 for PYY(3-36) action in this cell line was 2.1 nM. Non-linear regression analysis was performed with Origin 8 software using the highest FRET values for each data point. Note that the time scale is 1,200 s, thereby revealing short and long-term actions of forskolin and PYY(3-36) in this assay. B. Converse experiment in comparison to A in which forskolin was administered prior to PYY(3-36) using HEK293/hNPY2R/H188 c18 cells and the double injection protocol. Note that the time scale is 400 s, thereby revealing the fast action of PYY(3-36) (1 μM) to reduce the rate of increase of FRET. This NPY2R-mediated action of PYY(3-36) signifies Gi protein-mediated inhibition of adenylyl cyclase with resultant lowering of cAMP levels, as detected using H188.
Data analysis
-
Analysis using SoftMax Pro v.5.4.6.
After reading is finished, save the SoftMax Pro file with experimental data.
Use the SoftMax Pro export filter to create a .txt file containg FRET ratio values for each well of the plate.
Import the .txt file using Origin 8 to create a “Single ASCII” file.
Use Origin 8 to calculate the mean ± S.D. ratio value for each selected group of wells.
Use Origin 8 to plot mean ratio values vs time in graphical format.
Use the nonlinear regression analysis package in Origin 8 to analyse highest ΔFRET ratio values for each concentration of test substance so that dose-reponse relationships and EC50 values can be determined based on curve fitting ( Chepurny et al., 2018 and 2019).
Box and Whisker plots are generated using Origin 8 to display intra-assay variability of mean ratios obtained from vehicle or drug treated cells ( Chepurny et al., 2018 and 2019).
ANOVA tests in combination with Tukey HSD tests are used to establish if significant differences (P < 0.05) exist between mean ratio values obtained for cells treated with vehicle or test solutions ( Chepurny et al., 2018 and 2019).
-
Analysis using SoftMax Pro v.7: Please see Video 2
See Video 2 “FlexStation 3 data analysis” for details.
Recipes
-
Standard Extracellular Saline (SES) Solution, pH 7.4
138 mM NaCl
5.6 mM KCl
1.2 mM MgCl2
2.6 mM CaCl2
10 mM HEPES
11 mM Glucose
0.1% BSA
Sterilized by 0.2 μm vacuum filtration
Store at 4 °C
-
Rat Tail Collagen (RTC) Coating Solution (for one 96-well plate)
5.5 ml MilliQ water
6.3 μl Glacial Acetic Acid
95 μl Rat Tail Collagen
Note: Prepare fresh before use. Do not store.
Acknowledgments
This work was supported by NIH grant RO1-DK069575 to G.G.H and a grant to R.P.D. from the New York State NYSTAR program via the CASE center at Syracuse University.
Competing interests
The authors declare no competing financial interest.
Citation
Readers should cite both the Bio-protocol article and the original research article where this protocol was used.
References
- 1. Chepurny O. G., Leech C. A., Kelley G. G., Dzhura I., Dzhura E., Li X., Rindler M. J., Schwede F., Genieser H. G. and Holz G. G.(2009). Enhanced Rap1 activation and insulin secretagogue properties of an acetoxymethyl ester of an Epac-selective cyclic AMP analog in rat INS-1 cells: studies with 8-pCPT-2'-O-Me-cAMP-AM. J Biol Chem 284(16): 10728-10736. [DOI] [PMC free article] [PubMed] [Google Scholar]
- 2. Chepurny O. G., Bonaccorso R. L., Leech C. A., Wollert T., Langford G. M., Schwede F., Roth C. L., Doyle R. P. and Holz G. G.(2018). Chimeric peptide EP45 as a dual agonist at GLP-1 and NPY2R receptors. Sci Rep 8(1): 3749. [DOI] [PMC free article] [PubMed] [Google Scholar]
- 3. Chepurny O. G., Matsoukas M. T., Liapakis G., Leech C. A., Milliken B. T., Doyle R. P. and Holz G. G.(2019). Nonconventional glucagon and GLP-1 receptor agonist and antagonist interplay at the GLP-1 receptor revealed in high-throughput FRET assays for cAMP. J Biol Chem 294(10): 3514-3531. [DOI] [PMC free article] [PubMed] [Google Scholar]
- 4. Klarenbeek J., Goedhart J., van Batenburg A., Groenewald D. and Jalink K.(2015). Fourth-generation epac-based FRET sensors for cAMP feature exceptional brightness, photostability and dynamic range: characterization of dedicated sensors for FLIM, for ratiometry and with high affinity. PLoS One 10(4): e0122513. [DOI] [PMC free article] [PubMed] [Google Scholar]
- 5. Nagai T., Yamada S., Tominaga T., Ichikawa M. and Miyawaki A.(2004). Expanded dynamic range of fluorescent indicators for Ca2+ by circularly permuted yellow fluorescent proteins . Proc Natl Acad Sci U S A 101(29): 10554-10559. [DOI] [PMC free article] [PubMed] [Google Scholar]
- 6. Nikolaev V. O., Bunemann M., Hein L., Hannawacker A. and Lohse M. J.(2004). Novel single chain cAMP sensors for receptor-induced signal propagation. J Biol Chem 279(36): 37215-37218. [DOI] [PubMed] [Google Scholar]


