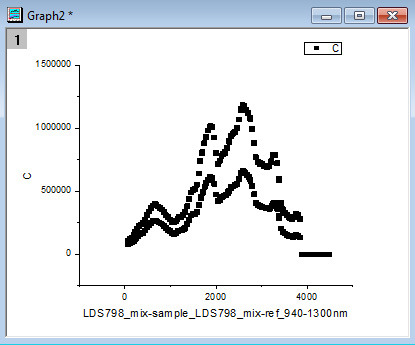
Figure 16. An example of the graph showing what the raw data looks like after the script auto-deletes the points when the laser is stabilizing.

This graph pops up after opening a file with the "2PA_sample_and_reference_autocalculation" Import Wizard filter. It is a visual check that the script worked as intended.
