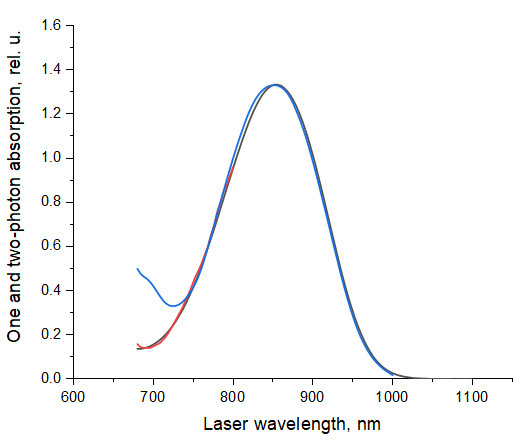
Figure 17. Spectral shapes on 1PA and 2PA spectra of Coumarin 540A in DMSO.

. The 1PA spectrum measured in this work, black line, and 2PA spectrum ( de Reguardati et al., 2016 ), blue line, are normalized at their peak values. The short wavelength part of the 2PA spectrum (680-800 nm), red line, was measured in this work, using Prodan in DMSO ( de Reguardati et al., 2016 ) as a standard.
