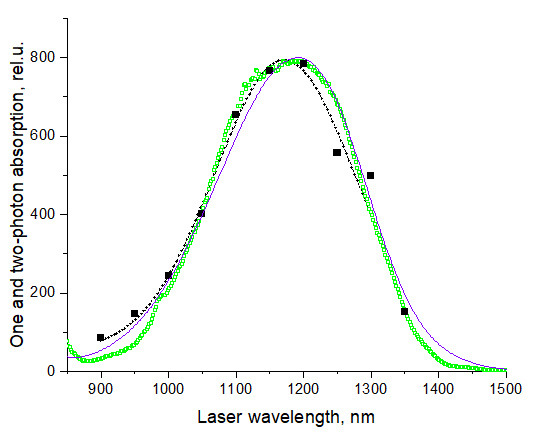
Figure 19. Spectral shapes of 1PA (purple line) (measured here) and 2PA spectra of LDS 798 in chloroform, green open squares–using fluorescence technique relatively to Styryl 9M, and black squares–using z-scan and absolute method.

( Makarov et al., 2011 ). All spectra are normalized at their peak values. Black dashed line shows a Gaussian fit to the z-scan data in the region from 900 to 1,300 nm that is used as an A2PA,R(λ) function here. This figure is adapted from ( Makarov et al., 2011 ).
